Bermudan vs Chilean High School Diploma
COMPARE
Bermudan
Chilean
High School Diploma
High School Diploma Comparison
Bermudans
Chileans
89.3%
HIGH SCHOOL DIPLOMA
61.1/ 100
METRIC RATING
162nd/ 347
METRIC RANK
89.6%
HIGH SCHOOL DIPLOMA
79.0/ 100
METRIC RATING
141st/ 347
METRIC RANK
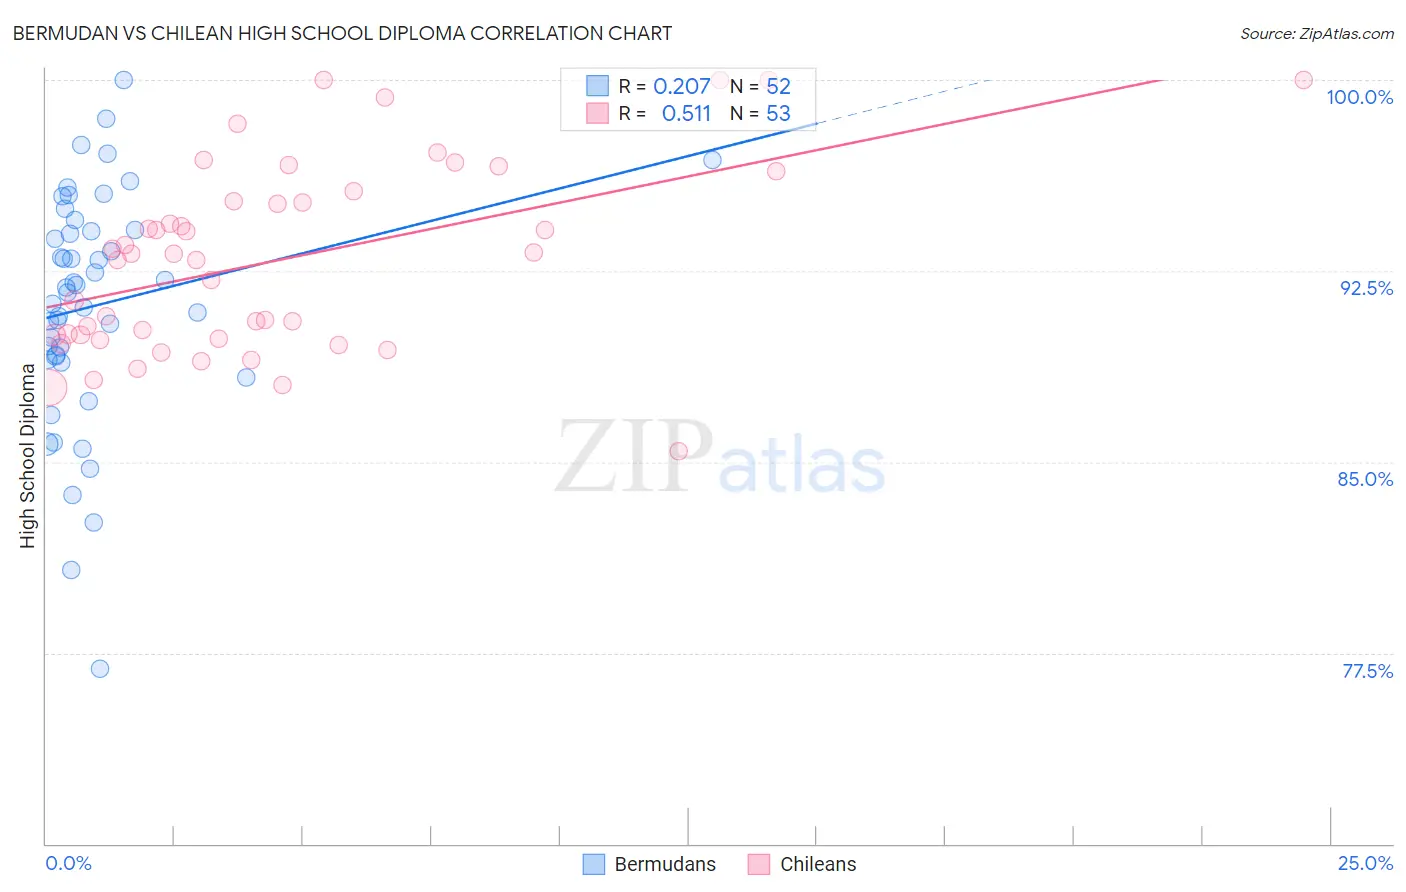
Bermudan vs Chilean High School Diploma Correlation Chart
The statistical analysis conducted on geographies consisting of 55,730,379 people shows a weak positive correlation between the proportion of Bermudans and percentage of population with at least high school diploma education in the United States with a correlation coefficient (R) of 0.207 and weighted average of 89.3%. Similarly, the statistical analysis conducted on geographies consisting of 256,681,007 people shows a substantial positive correlation between the proportion of Chileans and percentage of population with at least high school diploma education in the United States with a correlation coefficient (R) of 0.511 and weighted average of 89.6%, a difference of 0.33%.
High School Diploma Correlation Summary
| Measurement | Bermudan | Chilean |
| Minimum | 76.9% | 85.4% |
| Maximum | 100.0% | 100.0% |
| Range | 23.1% | 14.6% |
| Mean | 91.1% | 93.0% |
| Median | 91.7% | 93.2% |
| Interquartile 25% (IQ1) | 89.1% | 89.9% |
| Interquartile 75% (IQ3) | 94.1% | 95.4% |
| Interquartile Range (IQR) | 5.0% | 5.5% |
| Standard Deviation (Sample) | 4.6% | 3.7% |
| Standard Deviation (Population) | 4.5% | 3.6% |
Similar Demographics by High School Diploma
Demographics Similar to Bermudans by High School Diploma
In terms of high school diploma, the demographic groups most similar to Bermudans are Brazilian (89.3%, a difference of 0.0%), Cree (89.3%, a difference of 0.0%), Immigrants from Nepal (89.3%, a difference of 0.0%), Immigrants from China (89.3%, a difference of 0.010%), and Laotian (89.3%, a difference of 0.010%).
| Demographics | Rating | Rank | High School Diploma |
| Immigrants | Northern Africa | 66.4 /100 | #155 | Good 89.4% |
| Immigrants | Argentina | 65.5 /100 | #156 | Good 89.4% |
| Immigrants | Malaysia | 63.5 /100 | #157 | Good 89.3% |
| Immigrants | Pakistan | 62.5 /100 | #158 | Good 89.3% |
| Immigrants | China | 62.0 /100 | #159 | Good 89.3% |
| Laotians | 61.8 /100 | #160 | Good 89.3% |
| Brazilians | 61.2 /100 | #161 | Good 89.3% |
| Bermudans | 61.1 /100 | #162 | Good 89.3% |
| Cree | 61.1 /100 | #163 | Good 89.3% |
| Immigrants | Nepal | 61.1 /100 | #164 | Good 89.3% |
| Immigrants | Asia | 59.8 /100 | #165 | Average 89.3% |
| Immigrants | Albania | 59.4 /100 | #166 | Average 89.3% |
| Immigrants | Hong Kong | 58.6 /100 | #167 | Average 89.3% |
| Delaware | 55.8 /100 | #168 | Average 89.2% |
| Iroquois | 55.1 /100 | #169 | Average 89.2% |
Demographics Similar to Chileans by High School Diploma
In terms of high school diploma, the demographic groups most similar to Chileans are Indian (Asian) (89.6%, a difference of 0.0%), Pakistani (89.6%, a difference of 0.020%), Immigrants from Kenya (89.6%, a difference of 0.020%), Immigrants from Egypt (89.6%, a difference of 0.050%), and Immigrants from Brazil (89.5%, a difference of 0.050%).
| Demographics | Rating | Rank | High School Diploma |
| Immigrants | Jordan | 87.2 /100 | #134 | Excellent 89.8% |
| Chippewa | 85.6 /100 | #135 | Excellent 89.7% |
| Ugandans | 83.7 /100 | #136 | Excellent 89.7% |
| Arabs | 83.6 /100 | #137 | Excellent 89.7% |
| Assyrians/Chaldeans/Syriacs | 82.5 /100 | #138 | Excellent 89.7% |
| Kenyans | 81.4 /100 | #139 | Excellent 89.6% |
| Immigrants | Egypt | 81.2 /100 | #140 | Excellent 89.6% |
| Chileans | 79.0 /100 | #141 | Good 89.6% |
| Indians (Asian) | 78.8 /100 | #142 | Good 89.6% |
| Pakistanis | 78.3 /100 | #143 | Good 89.6% |
| Immigrants | Kenya | 78.0 /100 | #144 | Good 89.6% |
| Immigrants | Brazil | 76.6 /100 | #145 | Good 89.5% |
| Immigrants | Spain | 76.2 /100 | #146 | Good 89.5% |
| Iraqis | 73.9 /100 | #147 | Good 89.5% |
| Immigrants | Lebanon | 73.4 /100 | #148 | Good 89.5% |