Belizean vs Immigrants from Belgium Doctorate Degree
COMPARE
Belizean
Immigrants from Belgium
Doctorate Degree
Doctorate Degree Comparison
Belizeans
Immigrants from Belgium
1.4%
DOCTORATE DEGREE
0.1/ 100
METRIC RATING
299th/ 347
METRIC RANK
2.9%
DOCTORATE DEGREE
100.0/ 100
METRIC RATING
12th/ 347
METRIC RANK
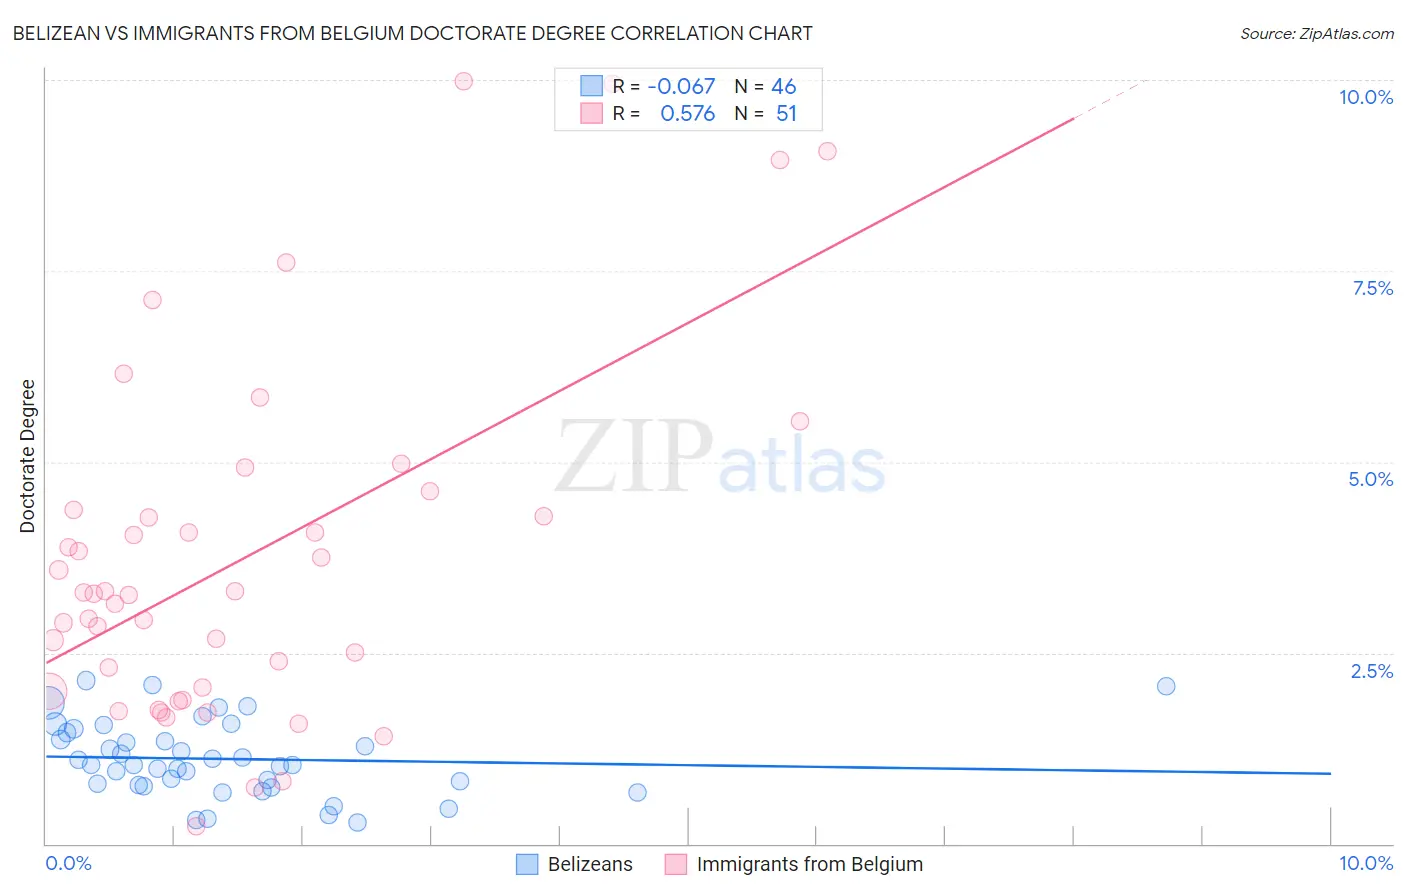
Belizean vs Immigrants from Belgium Doctorate Degree Correlation Chart
The statistical analysis conducted on geographies consisting of 143,625,069 people shows a slight negative correlation between the proportion of Belizeans and percentage of population with at least doctorate degree education in the United States with a correlation coefficient (R) of -0.067 and weighted average of 1.4%. Similarly, the statistical analysis conducted on geographies consisting of 146,436,412 people shows a substantial positive correlation between the proportion of Immigrants from Belgium and percentage of population with at least doctorate degree education in the United States with a correlation coefficient (R) of 0.576 and weighted average of 2.9%, a difference of 107.4%.
Doctorate Degree Correlation Summary
| Measurement | Belizean | Immigrants from Belgium |
| Minimum | 0.28% | 0.23% |
| Maximum | 2.1% | 10.0% |
| Range | 1.9% | 9.7% |
| Mean | 1.1% | 3.7% |
| Median | 1.0% | 3.3% |
| Interquartile 25% (IQ1) | 0.78% | 2.0% |
| Interquartile 75% (IQ3) | 1.5% | 4.4% |
| Interquartile Range (IQR) | 0.68% | 2.4% |
| Standard Deviation (Sample) | 0.48% | 2.3% |
| Standard Deviation (Population) | 0.48% | 2.3% |
Similar Demographics by Doctorate Degree
Demographics Similar to Belizeans by Doctorate Degree
In terms of doctorate degree, the demographic groups most similar to Belizeans are Immigrants from Guatemala (1.4%, a difference of 0.33%), Honduran (1.4%, a difference of 0.40%), Puerto Rican (1.4%, a difference of 0.43%), Shoshone (1.4%, a difference of 0.73%), and Immigrants from Dominica (1.4%, a difference of 0.76%).
| Demographics | Rating | Rank | Doctorate Degree |
| Alaska Natives | 0.3 /100 | #292 | Tragic 1.4% |
| Immigrants | Yemen | 0.2 /100 | #293 | Tragic 1.4% |
| Samoans | 0.2 /100 | #294 | Tragic 1.4% |
| Guatemalans | 0.2 /100 | #295 | Tragic 1.4% |
| Immigrants | Ecuador | 0.2 /100 | #296 | Tragic 1.4% |
| Tsimshian | 0.2 /100 | #297 | Tragic 1.4% |
| Puerto Ricans | 0.1 /100 | #298 | Tragic 1.4% |
| Belizeans | 0.1 /100 | #299 | Tragic 1.4% |
| Immigrants | Guatemala | 0.1 /100 | #300 | Tragic 1.4% |
| Hondurans | 0.1 /100 | #301 | Tragic 1.4% |
| Shoshone | 0.1 /100 | #302 | Tragic 1.4% |
| Immigrants | Dominica | 0.1 /100 | #303 | Tragic 1.4% |
| Mexican American Indians | 0.1 /100 | #304 | Tragic 1.4% |
| Pennsylvania Germans | 0.1 /100 | #305 | Tragic 1.4% |
| Guyanese | 0.1 /100 | #306 | Tragic 1.4% |
Demographics Similar to Immigrants from Belgium by Doctorate Degree
In terms of doctorate degree, the demographic groups most similar to Immigrants from Belgium are Indian (Asian) (2.9%, a difference of 0.66%), Immigrants from Sweden (2.9%, a difference of 0.94%), Immigrants from France (2.9%, a difference of 0.99%), Immigrants from India (2.8%, a difference of 2.1%), and Eastern European (2.8%, a difference of 2.5%).
| Demographics | Rating | Rank | Doctorate Degree |
| Iranians | 100.0 /100 | #5 | Exceptional 3.1% |
| Immigrants | Switzerland | 100.0 /100 | #6 | Exceptional 3.1% |
| Immigrants | China | 100.0 /100 | #7 | Exceptional 3.1% |
| Immigrants | Israel | 100.0 /100 | #8 | Exceptional 3.0% |
| Immigrants | Iran | 100.0 /100 | #9 | Exceptional 3.0% |
| Immigrants | Eastern Asia | 100.0 /100 | #10 | Exceptional 3.0% |
| Indians (Asian) | 100.0 /100 | #11 | Exceptional 2.9% |
| Immigrants | Belgium | 100.0 /100 | #12 | Exceptional 2.9% |
| Immigrants | Sweden | 100.0 /100 | #13 | Exceptional 2.9% |
| Immigrants | France | 100.0 /100 | #14 | Exceptional 2.9% |
| Immigrants | India | 100.0 /100 | #15 | Exceptional 2.8% |
| Eastern Europeans | 100.0 /100 | #16 | Exceptional 2.8% |
| Immigrants | Australia | 100.0 /100 | #17 | Exceptional 2.8% |
| Immigrants | Sri Lanka | 100.0 /100 | #18 | Exceptional 2.8% |
| Immigrants | Japan | 100.0 /100 | #19 | Exceptional 2.8% |