Belizean vs Immigrants from Belarus Doctorate Degree
COMPARE
Belizean
Immigrants from Belarus
Doctorate Degree
Doctorate Degree Comparison
Belizeans
Immigrants from Belarus
1.4%
DOCTORATE DEGREE
0.1/ 100
METRIC RATING
299th/ 347
METRIC RANK
2.2%
DOCTORATE DEGREE
99.7/ 100
METRIC RATING
78th/ 347
METRIC RANK
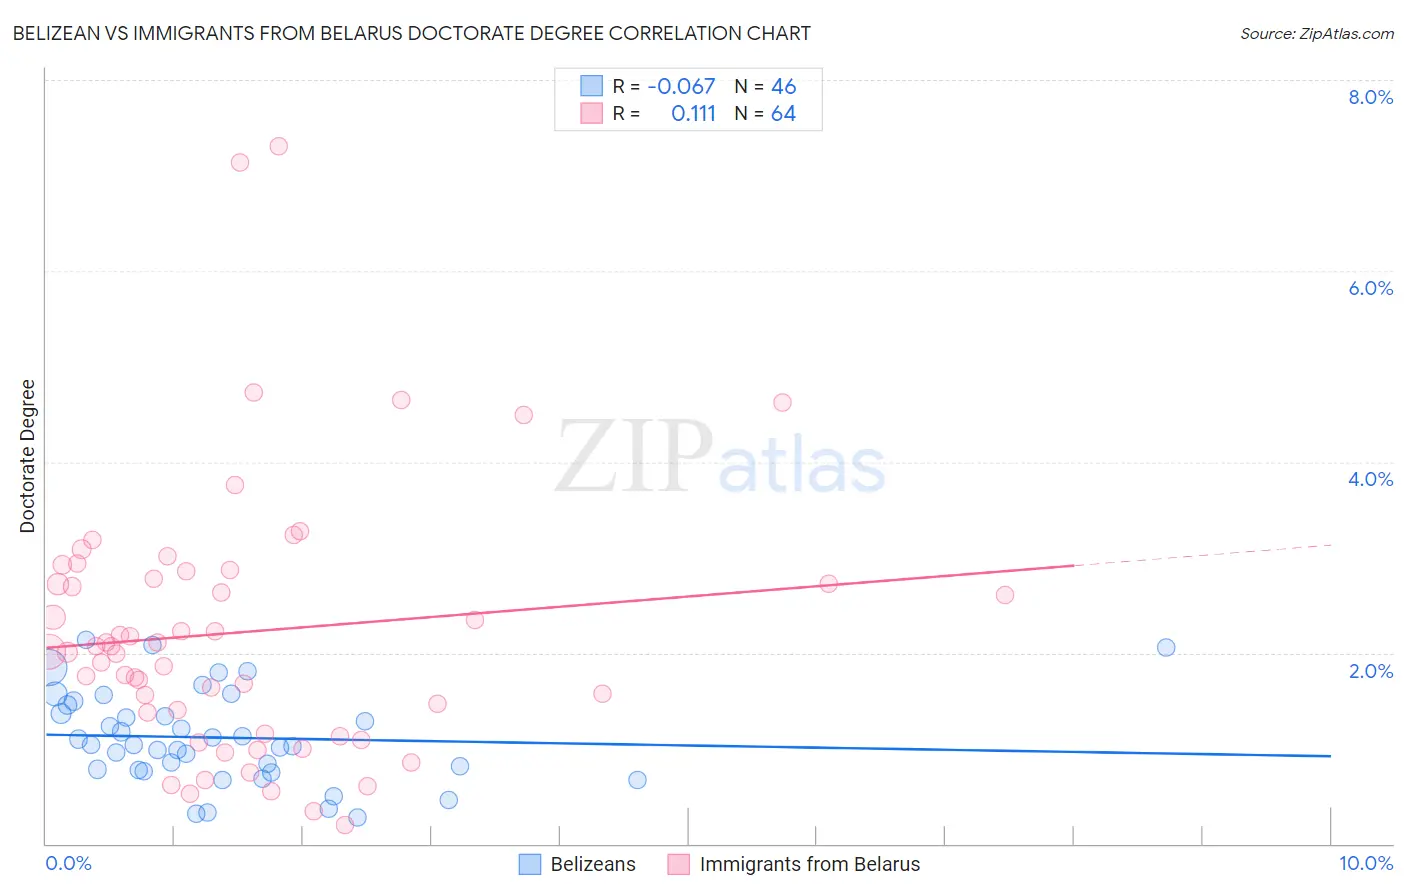
Belizean vs Immigrants from Belarus Doctorate Degree Correlation Chart
The statistical analysis conducted on geographies consisting of 143,625,069 people shows a slight negative correlation between the proportion of Belizeans and percentage of population with at least doctorate degree education in the United States with a correlation coefficient (R) of -0.067 and weighted average of 1.4%. Similarly, the statistical analysis conducted on geographies consisting of 150,000,226 people shows a poor positive correlation between the proportion of Immigrants from Belarus and percentage of population with at least doctorate degree education in the United States with a correlation coefficient (R) of 0.111 and weighted average of 2.2%, a difference of 60.3%.
Doctorate Degree Correlation Summary
| Measurement | Belizean | Immigrants from Belarus |
| Minimum | 0.28% | 0.19% |
| Maximum | 2.1% | 7.3% |
| Range | 1.9% | 7.1% |
| Mean | 1.1% | 2.2% |
| Median | 1.0% | 2.0% |
| Interquartile 25% (IQ1) | 0.78% | 1.3% |
| Interquartile 75% (IQ3) | 1.5% | 2.8% |
| Interquartile Range (IQR) | 0.68% | 1.6% |
| Standard Deviation (Sample) | 0.48% | 1.4% |
| Standard Deviation (Population) | 0.48% | 1.4% |
Similar Demographics by Doctorate Degree
Demographics Similar to Belizeans by Doctorate Degree
In terms of doctorate degree, the demographic groups most similar to Belizeans are Immigrants from Guatemala (1.4%, a difference of 0.33%), Honduran (1.4%, a difference of 0.40%), Puerto Rican (1.4%, a difference of 0.43%), Shoshone (1.4%, a difference of 0.73%), and Immigrants from Dominica (1.4%, a difference of 0.76%).
| Demographics | Rating | Rank | Doctorate Degree |
| Alaska Natives | 0.3 /100 | #292 | Tragic 1.4% |
| Immigrants | Yemen | 0.2 /100 | #293 | Tragic 1.4% |
| Samoans | 0.2 /100 | #294 | Tragic 1.4% |
| Guatemalans | 0.2 /100 | #295 | Tragic 1.4% |
| Immigrants | Ecuador | 0.2 /100 | #296 | Tragic 1.4% |
| Tsimshian | 0.2 /100 | #297 | Tragic 1.4% |
| Puerto Ricans | 0.1 /100 | #298 | Tragic 1.4% |
| Belizeans | 0.1 /100 | #299 | Tragic 1.4% |
| Immigrants | Guatemala | 0.1 /100 | #300 | Tragic 1.4% |
| Hondurans | 0.1 /100 | #301 | Tragic 1.4% |
| Shoshone | 0.1 /100 | #302 | Tragic 1.4% |
| Immigrants | Dominica | 0.1 /100 | #303 | Tragic 1.4% |
| Mexican American Indians | 0.1 /100 | #304 | Tragic 1.4% |
| Pennsylvania Germans | 0.1 /100 | #305 | Tragic 1.4% |
| Guyanese | 0.1 /100 | #306 | Tragic 1.4% |
Demographics Similar to Immigrants from Belarus by Doctorate Degree
In terms of doctorate degree, the demographic groups most similar to Immigrants from Belarus are Northern European (2.2%, a difference of 0.070%), Ugandan (2.2%, a difference of 0.35%), Immigrants from Argentina (2.2%, a difference of 0.40%), Immigrants from Lebanon (2.2%, a difference of 0.52%), and Immigrants from Hungary (2.2%, a difference of 0.53%).
| Demographics | Rating | Rank | Doctorate Degree |
| Immigrants | Bolivia | 99.8 /100 | #71 | Exceptional 2.3% |
| Immigrants | Canada | 99.8 /100 | #72 | Exceptional 2.3% |
| Immigrants | Bulgaria | 99.8 /100 | #73 | Exceptional 2.3% |
| Immigrants | North America | 99.8 /100 | #74 | Exceptional 2.2% |
| Immigrants | Western Asia | 99.8 /100 | #75 | Exceptional 2.2% |
| Immigrants | Hungary | 99.8 /100 | #76 | Exceptional 2.2% |
| Immigrants | Lebanon | 99.8 /100 | #77 | Exceptional 2.2% |
| Immigrants | Belarus | 99.7 /100 | #78 | Exceptional 2.2% |
| Northern Europeans | 99.7 /100 | #79 | Exceptional 2.2% |
| Ugandans | 99.7 /100 | #80 | Exceptional 2.2% |
| Immigrants | Argentina | 99.7 /100 | #81 | Exceptional 2.2% |
| Immigrants | Uganda | 99.6 /100 | #82 | Exceptional 2.2% |
| Immigrants | Lithuania | 99.6 /100 | #83 | Exceptional 2.2% |
| Immigrants | England | 99.6 /100 | #84 | Exceptional 2.2% |
| Immigrants | Brazil | 99.6 /100 | #85 | Exceptional 2.2% |