Australian vs Puerto Rican Master's Degree
COMPARE
Australian
Puerto Rican
Master's Degree
Master's Degree Comparison
Australians
Puerto Ricans
18.4%
MASTER'S DEGREE
99.9/ 100
METRIC RATING
58th/ 347
METRIC RANK
11.2%
MASTER'S DEGREE
0.0/ 100
METRIC RATING
308th/ 347
METRIC RANK
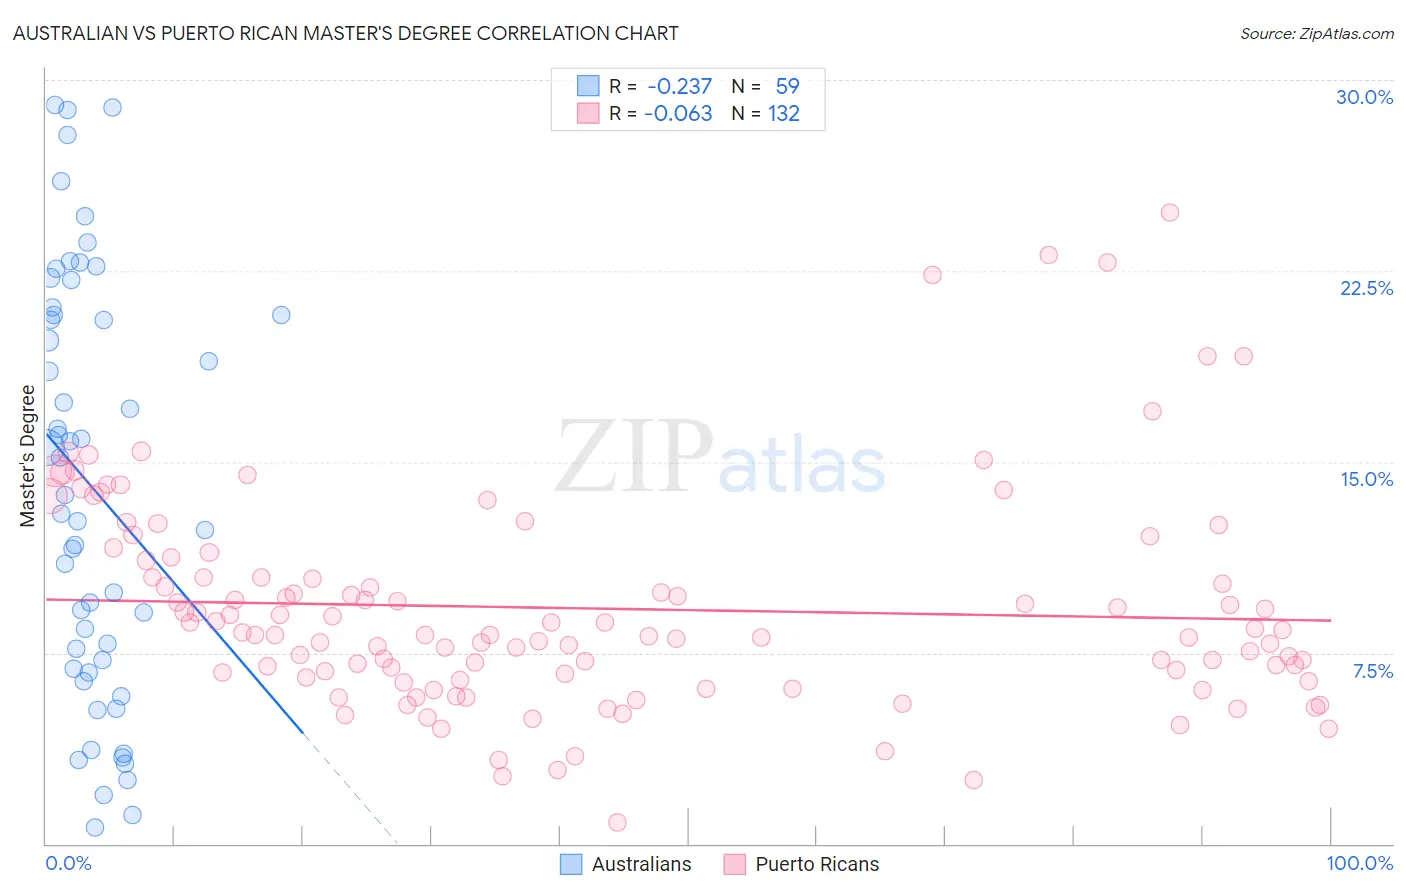
Australian vs Puerto Rican Master's Degree Correlation Chart
The statistical analysis conducted on geographies consisting of 224,102,387 people shows a weak negative correlation between the proportion of Australians and percentage of population with at least master's degree education in the United States with a correlation coefficient (R) of -0.237 and weighted average of 18.4%. Similarly, the statistical analysis conducted on geographies consisting of 527,764,929 people shows a slight negative correlation between the proportion of Puerto Ricans and percentage of population with at least master's degree education in the United States with a correlation coefficient (R) of -0.063 and weighted average of 11.2%, a difference of 64.7%.
Master's Degree Correlation Summary
| Measurement | Australian | Puerto Rican |
| Minimum | 0.65% | 0.86% |
| Maximum | 29.0% | 24.8% |
| Range | 28.4% | 23.9% |
| Mean | 14.0% | 9.2% |
| Median | 13.7% | 8.2% |
| Interquartile 25% (IQ1) | 6.9% | 6.6% |
| Interquartile 75% (IQ3) | 20.7% | 10.8% |
| Interquartile Range (IQR) | 13.9% | 4.2% |
| Standard Deviation (Sample) | 8.1% | 4.2% |
| Standard Deviation (Population) | 8.1% | 4.2% |
Similar Demographics by Master's Degree
Demographics Similar to Australians by Master's Degree
In terms of master's degree, the demographic groups most similar to Australians are Immigrants from Asia (18.4%, a difference of 0.13%), Asian (18.4%, a difference of 0.27%), Immigrants from Bulgaria (18.3%, a difference of 0.44%), Immigrants from Serbia (18.5%, a difference of 0.49%), and Immigrants from Lithuania (18.5%, a difference of 0.53%).
| Demographics | Rating | Rank | Master's Degree |
| Immigrants | South Africa | 100.0 /100 | #51 | Exceptional 18.8% |
| Immigrants | Kuwait | 100.0 /100 | #52 | Exceptional 18.6% |
| Immigrants | Czechoslovakia | 99.9 /100 | #53 | Exceptional 18.5% |
| Immigrants | Lithuania | 99.9 /100 | #54 | Exceptional 18.5% |
| Immigrants | Serbia | 99.9 /100 | #55 | Exceptional 18.5% |
| Asians | 99.9 /100 | #56 | Exceptional 18.4% |
| Immigrants | Asia | 99.9 /100 | #57 | Exceptional 18.4% |
| Australians | 99.9 /100 | #58 | Exceptional 18.4% |
| Immigrants | Bulgaria | 99.9 /100 | #59 | Exceptional 18.3% |
| New Zealanders | 99.9 /100 | #60 | Exceptional 18.3% |
| Immigrants | Europe | 99.9 /100 | #61 | Exceptional 18.2% |
| Argentineans | 99.9 /100 | #62 | Exceptional 18.2% |
| Immigrants | Netherlands | 99.9 /100 | #63 | Exceptional 18.1% |
| South Africans | 99.9 /100 | #64 | Exceptional 18.1% |
| Immigrants | Kazakhstan | 99.8 /100 | #65 | Exceptional 18.0% |
Demographics Similar to Puerto Ricans by Master's Degree
In terms of master's degree, the demographic groups most similar to Puerto Ricans are Puget Sound Salish (11.1%, a difference of 0.29%), Cheyenne (11.2%, a difference of 0.55%), Shoshone (11.1%, a difference of 0.65%), Mexican American Indian (11.2%, a difference of 0.70%), and Immigrants from Latin America (11.3%, a difference of 0.89%).
| Demographics | Rating | Rank | Master's Degree |
| Tsimshian | 0.1 /100 | #301 | Tragic 11.4% |
| Cherokee | 0.1 /100 | #302 | Tragic 11.4% |
| Immigrants | Laos | 0.1 /100 | #303 | Tragic 11.4% |
| Immigrants | Cabo Verde | 0.1 /100 | #304 | Tragic 11.3% |
| Immigrants | Latin America | 0.0 /100 | #305 | Tragic 11.3% |
| Mexican American Indians | 0.0 /100 | #306 | Tragic 11.2% |
| Cheyenne | 0.0 /100 | #307 | Tragic 11.2% |
| Puerto Ricans | 0.0 /100 | #308 | Tragic 11.2% |
| Puget Sound Salish | 0.0 /100 | #309 | Tragic 11.1% |
| Shoshone | 0.0 /100 | #310 | Tragic 11.1% |
| Seminole | 0.0 /100 | #311 | Tragic 11.0% |
| Choctaw | 0.0 /100 | #312 | Tragic 11.0% |
| Yaqui | 0.0 /100 | #313 | Tragic 11.0% |
| Cajuns | 0.0 /100 | #314 | Tragic 11.0% |
| Apache | 0.0 /100 | #315 | Tragic 11.0% |