Australian vs Immigrants from Zimbabwe Master's Degree
COMPARE
Australian
Immigrants from Zimbabwe
Master's Degree
Master's Degree Comparison
Australians
Immigrants from Zimbabwe
18.4%
MASTER'S DEGREE
99.9/ 100
METRIC RATING
58th/ 347
METRIC RANK
17.4%
MASTER'S DEGREE
99.5/ 100
METRIC RATING
83rd/ 347
METRIC RANK
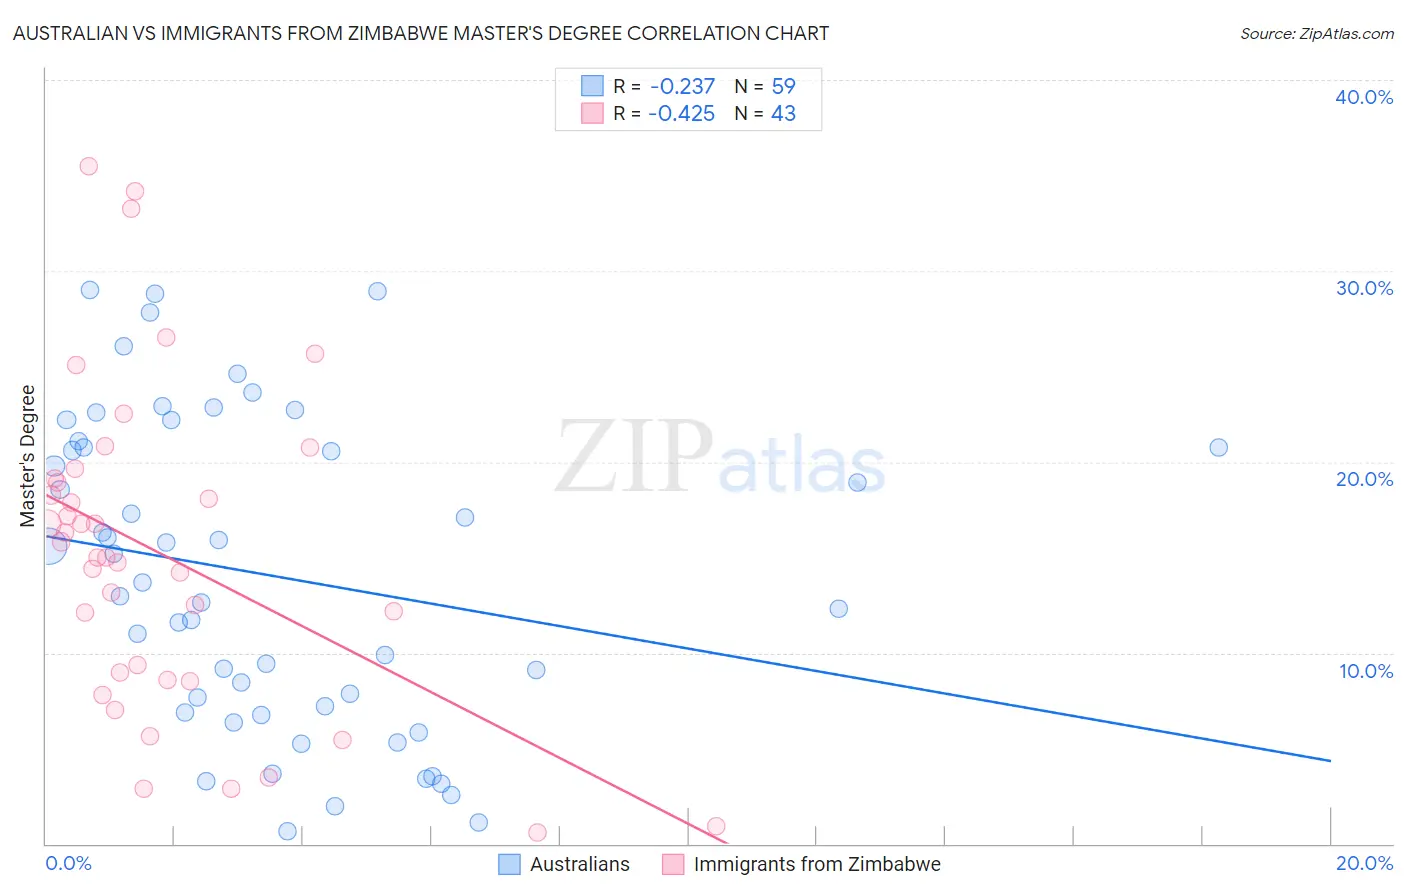
Australian vs Immigrants from Zimbabwe Master's Degree Correlation Chart
The statistical analysis conducted on geographies consisting of 224,102,387 people shows a weak negative correlation between the proportion of Australians and percentage of population with at least master's degree education in the United States with a correlation coefficient (R) of -0.237 and weighted average of 18.4%. Similarly, the statistical analysis conducted on geographies consisting of 117,807,833 people shows a moderate negative correlation between the proportion of Immigrants from Zimbabwe and percentage of population with at least master's degree education in the United States with a correlation coefficient (R) of -0.425 and weighted average of 17.4%, a difference of 5.5%.
Master's Degree Correlation Summary
| Measurement | Australian | Immigrants from Zimbabwe |
| Minimum | 0.65% | 0.61% |
| Maximum | 29.0% | 35.5% |
| Range | 28.4% | 34.9% |
| Mean | 14.0% | 15.1% |
| Median | 13.7% | 15.0% |
| Interquartile 25% (IQ1) | 6.9% | 8.6% |
| Interquartile 75% (IQ3) | 20.7% | 19.1% |
| Interquartile Range (IQR) | 13.9% | 10.5% |
| Standard Deviation (Sample) | 8.1% | 8.4% |
| Standard Deviation (Population) | 8.1% | 8.3% |
Similar Demographics by Master's Degree
Demographics Similar to Australians by Master's Degree
In terms of master's degree, the demographic groups most similar to Australians are Immigrants from Asia (18.4%, a difference of 0.13%), Asian (18.4%, a difference of 0.27%), Immigrants from Bulgaria (18.3%, a difference of 0.44%), Immigrants from Serbia (18.5%, a difference of 0.49%), and Immigrants from Lithuania (18.5%, a difference of 0.53%).
| Demographics | Rating | Rank | Master's Degree |
| Immigrants | South Africa | 100.0 /100 | #51 | Exceptional 18.8% |
| Immigrants | Kuwait | 100.0 /100 | #52 | Exceptional 18.6% |
| Immigrants | Czechoslovakia | 99.9 /100 | #53 | Exceptional 18.5% |
| Immigrants | Lithuania | 99.9 /100 | #54 | Exceptional 18.5% |
| Immigrants | Serbia | 99.9 /100 | #55 | Exceptional 18.5% |
| Asians | 99.9 /100 | #56 | Exceptional 18.4% |
| Immigrants | Asia | 99.9 /100 | #57 | Exceptional 18.4% |
| Australians | 99.9 /100 | #58 | Exceptional 18.4% |
| Immigrants | Bulgaria | 99.9 /100 | #59 | Exceptional 18.3% |
| New Zealanders | 99.9 /100 | #60 | Exceptional 18.3% |
| Immigrants | Europe | 99.9 /100 | #61 | Exceptional 18.2% |
| Argentineans | 99.9 /100 | #62 | Exceptional 18.2% |
| Immigrants | Netherlands | 99.9 /100 | #63 | Exceptional 18.1% |
| South Africans | 99.9 /100 | #64 | Exceptional 18.1% |
| Immigrants | Kazakhstan | 99.8 /100 | #65 | Exceptional 18.0% |
Demographics Similar to Immigrants from Zimbabwe by Master's Degree
In terms of master's degree, the demographic groups most similar to Immigrants from Zimbabwe are Greek (17.5%, a difference of 0.050%), Immigrants from Western Asia (17.5%, a difference of 0.11%), Immigrants from Scotland (17.4%, a difference of 0.33%), Carpatho Rusyn (17.5%, a difference of 0.40%), and Immigrants from Lebanon (17.5%, a difference of 0.46%).
| Demographics | Rating | Rank | Master's Degree |
| Immigrants | Indonesia | 99.6 /100 | #76 | Exceptional 17.6% |
| Immigrants | Eastern Europe | 99.6 /100 | #77 | Exceptional 17.6% |
| Immigrants | Hungary | 99.6 /100 | #78 | Exceptional 17.5% |
| Immigrants | Lebanon | 99.6 /100 | #79 | Exceptional 17.5% |
| Carpatho Rusyns | 99.6 /100 | #80 | Exceptional 17.5% |
| Immigrants | Western Asia | 99.5 /100 | #81 | Exceptional 17.5% |
| Greeks | 99.5 /100 | #82 | Exceptional 17.5% |
| Immigrants | Zimbabwe | 99.5 /100 | #83 | Exceptional 17.4% |
| Immigrants | Scotland | 99.4 /100 | #84 | Exceptional 17.4% |
| Immigrants | Brazil | 99.4 /100 | #85 | Exceptional 17.4% |
| Immigrants | Croatia | 99.3 /100 | #86 | Exceptional 17.3% |
| Maltese | 99.3 /100 | #87 | Exceptional 17.3% |
| Immigrants | Canada | 99.2 /100 | #88 | Exceptional 17.2% |
| Bhutanese | 99.1 /100 | #89 | Exceptional 17.2% |
| Immigrants | Egypt | 99.1 /100 | #90 | Exceptional 17.2% |