Australian vs French Canadian Bachelor's Degree
COMPARE
Australian
French Canadian
Bachelor's Degree
Bachelor's Degree Comparison
Australians
French Canadians
44.0%
BACHELOR'S DEGREE
99.9/ 100
METRIC RATING
59th/ 347
METRIC RANK
35.6%
BACHELOR'S DEGREE
8.3/ 100
METRIC RATING
223rd/ 347
METRIC RANK
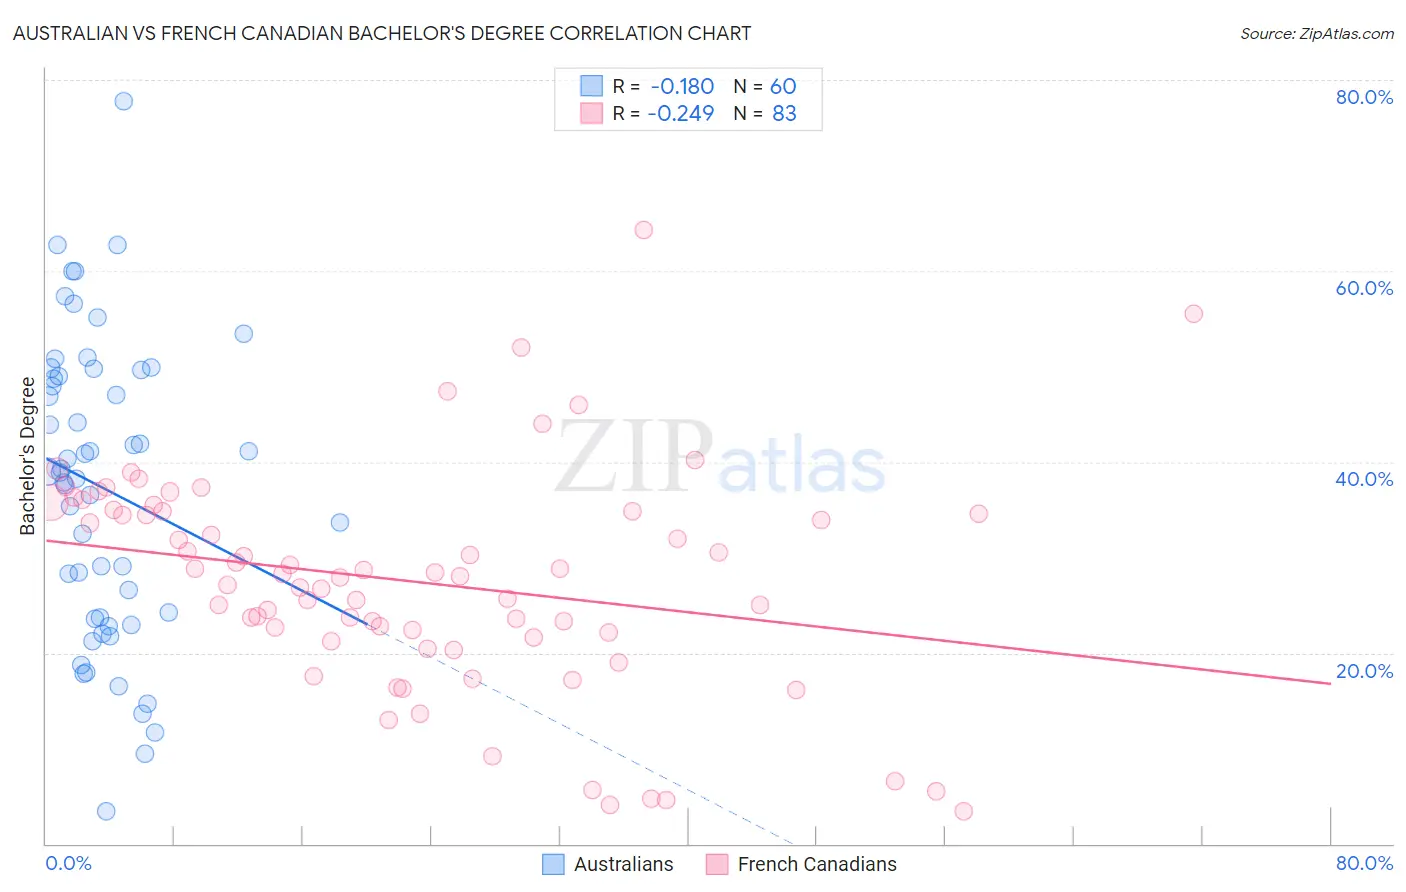
Australian vs French Canadian Bachelor's Degree Correlation Chart
The statistical analysis conducted on geographies consisting of 224,140,970 people shows a poor negative correlation between the proportion of Australians and percentage of population with at least bachelor's degree education in the United States with a correlation coefficient (R) of -0.180 and weighted average of 44.0%. Similarly, the statistical analysis conducted on geographies consisting of 502,615,411 people shows a weak negative correlation between the proportion of French Canadians and percentage of population with at least bachelor's degree education in the United States with a correlation coefficient (R) of -0.249 and weighted average of 35.6%, a difference of 23.5%.
Bachelor's Degree Correlation Summary
| Measurement | Australian | French Canadian |
| Minimum | 3.4% | 3.4% |
| Maximum | 77.7% | 64.3% |
| Range | 74.3% | 60.9% |
| Mean | 37.3% | 27.5% |
| Median | 38.9% | 28.0% |
| Interquartile 25% (IQ1) | 23.7% | 21.6% |
| Interquartile 75% (IQ3) | 49.3% | 34.8% |
| Interquartile Range (IQR) | 25.7% | 13.2% |
| Standard Deviation (Sample) | 15.6% | 11.6% |
| Standard Deviation (Population) | 15.5% | 11.5% |
Similar Demographics by Bachelor's Degree
Demographics Similar to Australians by Bachelor's Degree
In terms of bachelor's degree, the demographic groups most similar to Australians are New Zealander (44.0%, a difference of 0.010%), Immigrants from Czechoslovakia (44.0%, a difference of 0.10%), Paraguayan (44.0%, a difference of 0.16%), Immigrants from Serbia (44.1%, a difference of 0.34%), and Immigrants from Austria (44.2%, a difference of 0.53%).
| Demographics | Rating | Rank | Bachelor's Degree |
| Immigrants | Spain | 99.9 /100 | #52 | Exceptional 44.3% |
| Immigrants | Asia | 99.9 /100 | #53 | Exceptional 44.3% |
| Immigrants | Austria | 99.9 /100 | #54 | Exceptional 44.2% |
| Immigrants | Bolivia | 99.9 /100 | #55 | Exceptional 44.2% |
| Immigrants | Serbia | 99.9 /100 | #56 | Exceptional 44.1% |
| Paraguayans | 99.9 /100 | #57 | Exceptional 44.0% |
| Immigrants | Czechoslovakia | 99.9 /100 | #58 | Exceptional 44.0% |
| Australians | 99.9 /100 | #59 | Exceptional 44.0% |
| New Zealanders | 99.9 /100 | #60 | Exceptional 44.0% |
| South Africans | 99.8 /100 | #61 | Exceptional 43.6% |
| Immigrants | Kazakhstan | 99.8 /100 | #62 | Exceptional 43.4% |
| Immigrants | Europe | 99.8 /100 | #63 | Exceptional 43.4% |
| Argentineans | 99.7 /100 | #64 | Exceptional 43.3% |
| Zimbabweans | 99.7 /100 | #65 | Exceptional 43.3% |
| Immigrants | Netherlands | 99.7 /100 | #66 | Exceptional 43.3% |
Demographics Similar to French Canadians by Bachelor's Degree
In terms of bachelor's degree, the demographic groups most similar to French Canadians are Trinidadian and Tobagonian (35.7%, a difference of 0.18%), Immigrants from Barbados (35.5%, a difference of 0.28%), Dutch (35.7%, a difference of 0.32%), Immigrants from Burma/Myanmar (35.5%, a difference of 0.35%), and Portuguese (35.5%, a difference of 0.38%).
| Demographics | Rating | Rank | Bachelor's Degree |
| Barbadians | 13.5 /100 | #216 | Poor 36.1% |
| German Russians | 10.2 /100 | #217 | Poor 35.8% |
| Sub-Saharan Africans | 9.8 /100 | #218 | Tragic 35.8% |
| West Indians | 9.7 /100 | #219 | Tragic 35.8% |
| Spanish | 9.6 /100 | #220 | Tragic 35.8% |
| Dutch | 9.2 /100 | #221 | Tragic 35.7% |
| Trinidadians and Tobagonians | 8.8 /100 | #222 | Tragic 35.7% |
| French Canadians | 8.3 /100 | #223 | Tragic 35.6% |
| Immigrants | Barbados | 7.5 /100 | #224 | Tragic 35.5% |
| Immigrants | Burma/Myanmar | 7.3 /100 | #225 | Tragic 35.5% |
| Portuguese | 7.2 /100 | #226 | Tragic 35.5% |
| Ecuadorians | 6.6 /100 | #227 | Tragic 35.4% |
| Immigrants | Trinidad and Tobago | 6.0 /100 | #228 | Tragic 35.3% |
| Whites/Caucasians | 5.9 /100 | #229 | Tragic 35.3% |
| Immigrants | Grenada | 4.3 /100 | #230 | Tragic 35.0% |