Australian vs Blackfeet Bachelor's Degree
COMPARE
Australian
Blackfeet
Bachelor's Degree
Bachelor's Degree Comparison
Australians
Blackfeet
44.0%
BACHELOR'S DEGREE
99.9/ 100
METRIC RATING
59th/ 347
METRIC RANK
31.5%
BACHELOR'S DEGREE
0.1/ 100
METRIC RATING
281st/ 347
METRIC RANK
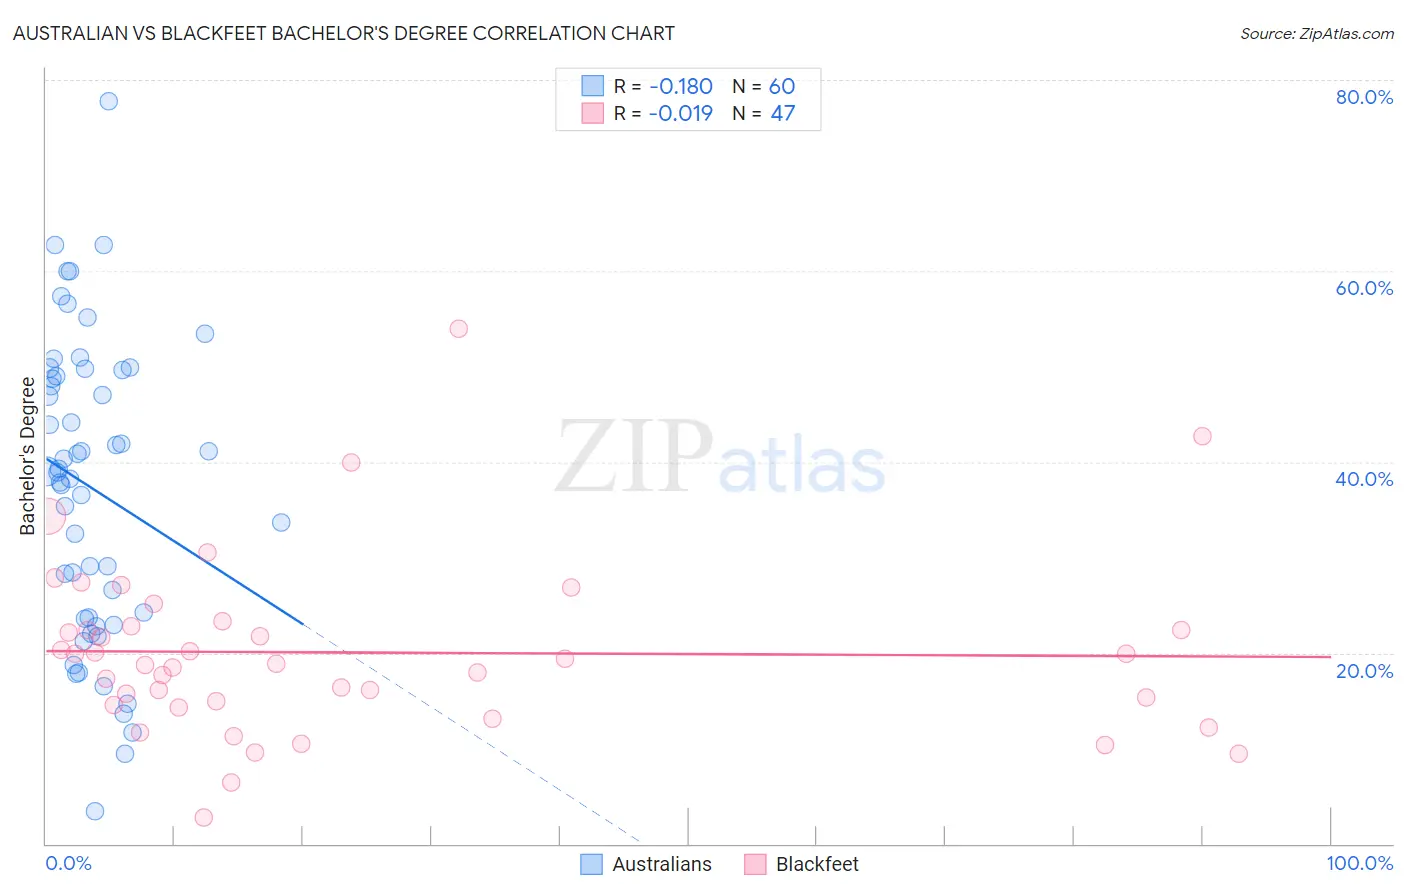
Australian vs Blackfeet Bachelor's Degree Correlation Chart
The statistical analysis conducted on geographies consisting of 224,140,970 people shows a poor negative correlation between the proportion of Australians and percentage of population with at least bachelor's degree education in the United States with a correlation coefficient (R) of -0.180 and weighted average of 44.0%. Similarly, the statistical analysis conducted on geographies consisting of 309,572,502 people shows no correlation between the proportion of Blackfeet and percentage of population with at least bachelor's degree education in the United States with a correlation coefficient (R) of -0.019 and weighted average of 31.5%, a difference of 39.8%.
Bachelor's Degree Correlation Summary
| Measurement | Australian | Blackfeet |
| Minimum | 3.4% | 2.7% |
| Maximum | 77.7% | 53.9% |
| Range | 74.3% | 51.2% |
| Mean | 37.3% | 20.0% |
| Median | 38.9% | 18.9% |
| Interquartile 25% (IQ1) | 23.7% | 14.5% |
| Interquartile 75% (IQ3) | 49.3% | 22.7% |
| Interquartile Range (IQR) | 25.7% | 8.2% |
| Standard Deviation (Sample) | 15.6% | 9.3% |
| Standard Deviation (Population) | 15.5% | 9.2% |
Similar Demographics by Bachelor's Degree
Demographics Similar to Australians by Bachelor's Degree
In terms of bachelor's degree, the demographic groups most similar to Australians are New Zealander (44.0%, a difference of 0.010%), Immigrants from Czechoslovakia (44.0%, a difference of 0.10%), Paraguayan (44.0%, a difference of 0.16%), Immigrants from Serbia (44.1%, a difference of 0.34%), and Immigrants from Austria (44.2%, a difference of 0.53%).
| Demographics | Rating | Rank | Bachelor's Degree |
| Immigrants | Spain | 99.9 /100 | #52 | Exceptional 44.3% |
| Immigrants | Asia | 99.9 /100 | #53 | Exceptional 44.3% |
| Immigrants | Austria | 99.9 /100 | #54 | Exceptional 44.2% |
| Immigrants | Bolivia | 99.9 /100 | #55 | Exceptional 44.2% |
| Immigrants | Serbia | 99.9 /100 | #56 | Exceptional 44.1% |
| Paraguayans | 99.9 /100 | #57 | Exceptional 44.0% |
| Immigrants | Czechoslovakia | 99.9 /100 | #58 | Exceptional 44.0% |
| Australians | 99.9 /100 | #59 | Exceptional 44.0% |
| New Zealanders | 99.9 /100 | #60 | Exceptional 44.0% |
| South Africans | 99.8 /100 | #61 | Exceptional 43.6% |
| Immigrants | Kazakhstan | 99.8 /100 | #62 | Exceptional 43.4% |
| Immigrants | Europe | 99.8 /100 | #63 | Exceptional 43.4% |
| Argentineans | 99.7 /100 | #64 | Exceptional 43.3% |
| Zimbabweans | 99.7 /100 | #65 | Exceptional 43.3% |
| Immigrants | Netherlands | 99.7 /100 | #66 | Exceptional 43.3% |
Demographics Similar to Blackfeet by Bachelor's Degree
In terms of bachelor's degree, the demographic groups most similar to Blackfeet are Immigrants from Caribbean (31.4%, a difference of 0.15%), Honduran (31.3%, a difference of 0.42%), Haitian (31.3%, a difference of 0.45%), Immigrants from Laos (31.6%, a difference of 0.46%), and Aleut (31.3%, a difference of 0.47%).
| Demographics | Rating | Rank | Bachelor's Degree |
| Potawatomi | 0.2 /100 | #274 | Tragic 31.9% |
| Samoans | 0.1 /100 | #275 | Tragic 31.8% |
| Salvadorans | 0.1 /100 | #276 | Tragic 31.8% |
| Dominicans | 0.1 /100 | #277 | Tragic 31.8% |
| Marshallese | 0.1 /100 | #278 | Tragic 31.7% |
| Hawaiians | 0.1 /100 | #279 | Tragic 31.6% |
| Immigrants | Laos | 0.1 /100 | #280 | Tragic 31.6% |
| Blackfeet | 0.1 /100 | #281 | Tragic 31.5% |
| Immigrants | Caribbean | 0.1 /100 | #282 | Tragic 31.4% |
| Hondurans | 0.1 /100 | #283 | Tragic 31.3% |
| Haitians | 0.1 /100 | #284 | Tragic 31.3% |
| Aleuts | 0.1 /100 | #285 | Tragic 31.3% |
| Immigrants | El Salvador | 0.1 /100 | #286 | Tragic 31.3% |
| Ottawa | 0.1 /100 | #287 | Tragic 31.1% |
| Guatemalans | 0.1 /100 | #288 | Tragic 31.0% |