Assyrian/Chaldean/Syriac vs Immigrants from Ecuador Doctorate Degree
COMPARE
Assyrian/Chaldean/Syriac
Immigrants from Ecuador
Doctorate Degree
Doctorate Degree Comparison
Assyrians/Chaldeans/Syriacs
Immigrants from Ecuador
1.7%
DOCTORATE DEGREE
5.9/ 100
METRIC RATING
228th/ 347
METRIC RANK
1.4%
DOCTORATE DEGREE
0.2/ 100
METRIC RATING
296th/ 347
METRIC RANK
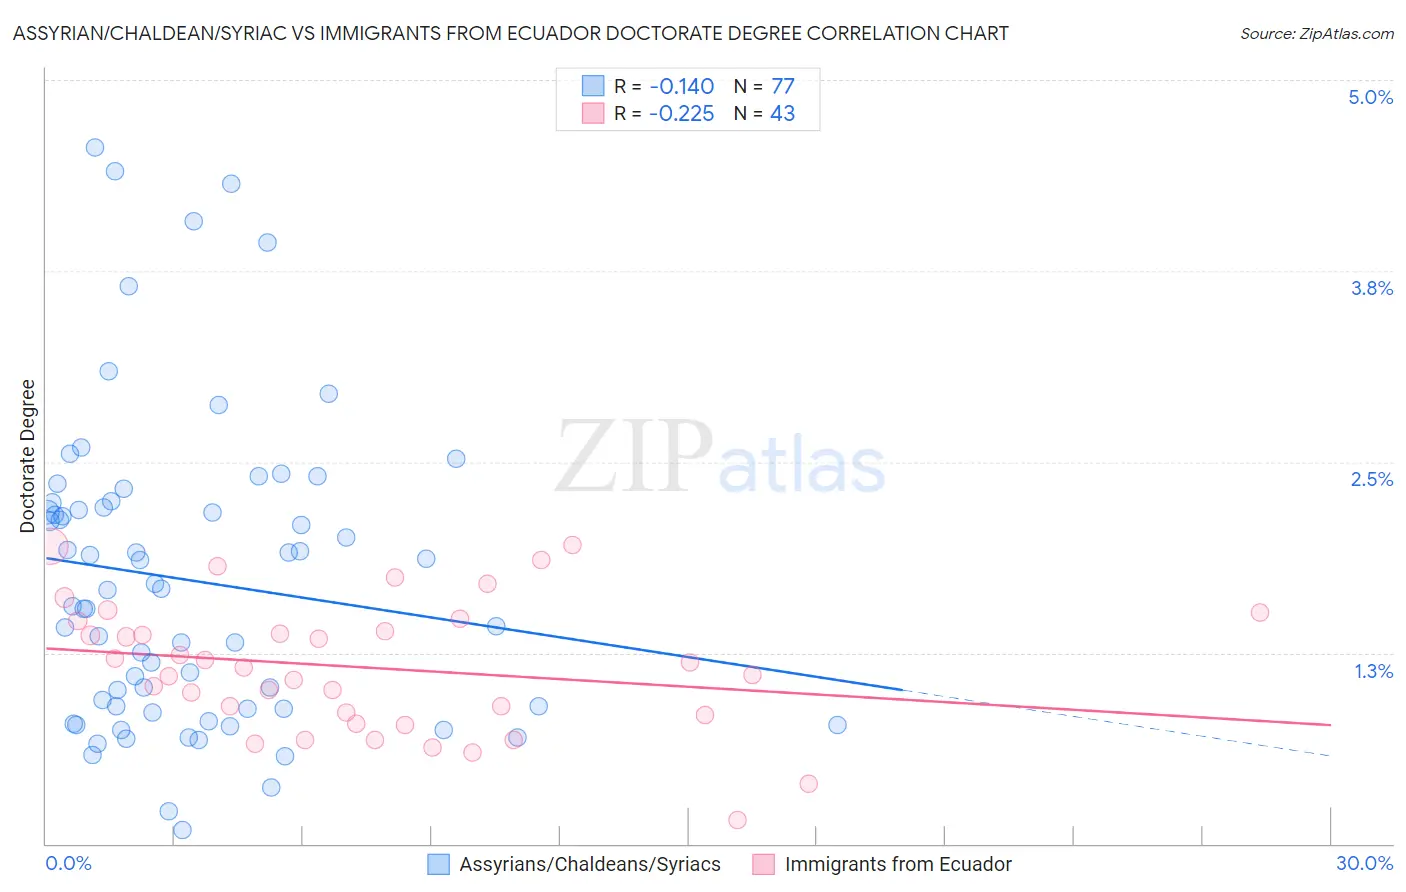
Assyrian/Chaldean/Syriac vs Immigrants from Ecuador Doctorate Degree Correlation Chart
The statistical analysis conducted on geographies consisting of 110,001,704 people shows a poor negative correlation between the proportion of Assyrians/Chaldeans/Syriacs and percentage of population with at least doctorate degree education in the United States with a correlation coefficient (R) of -0.140 and weighted average of 1.7%. Similarly, the statistical analysis conducted on geographies consisting of 269,753,528 people shows a weak negative correlation between the proportion of Immigrants from Ecuador and percentage of population with at least doctorate degree education in the United States with a correlation coefficient (R) of -0.225 and weighted average of 1.4%, a difference of 17.3%.
Doctorate Degree Correlation Summary
| Measurement | Assyrian/Chaldean/Syriac | Immigrants from Ecuador |
| Minimum | 0.087% | 0.16% |
| Maximum | 4.6% | 2.0% |
| Range | 4.5% | 1.8% |
| Mean | 1.7% | 1.2% |
| Median | 1.7% | 1.2% |
| Interquartile 25% (IQ1) | 0.88% | 0.84% |
| Interquartile 75% (IQ3) | 2.2% | 1.5% |
| Interquartile Range (IQR) | 1.3% | 0.62% |
| Standard Deviation (Sample) | 1.0% | 0.42% |
| Standard Deviation (Population) | 1.00% | 0.42% |
Similar Demographics by Doctorate Degree
Demographics Similar to Assyrians/Chaldeans/Syriacs by Doctorate Degree
In terms of doctorate degree, the demographic groups most similar to Assyrians/Chaldeans/Syriacs are Panamanian (1.7%, a difference of 0.28%), Osage (1.7%, a difference of 0.42%), Immigrants from Colombia (1.7%, a difference of 0.53%), Colville (1.6%, a difference of 1.0%), and Immigrants from Poland (1.7%, a difference of 1.0%).
| Demographics | Rating | Rank | Doctorate Degree |
| Immigrants | Nonimmigrants | 8.8 /100 | #221 | Tragic 1.7% |
| Immigrants | Venezuela | 8.7 /100 | #222 | Tragic 1.7% |
| Immigrants | Bosnia and Herzegovina | 7.8 /100 | #223 | Tragic 1.7% |
| Immigrants | Poland | 7.4 /100 | #224 | Tragic 1.7% |
| Immigrants | Colombia | 6.7 /100 | #225 | Tragic 1.7% |
| Osage | 6.5 /100 | #226 | Tragic 1.7% |
| Panamanians | 6.3 /100 | #227 | Tragic 1.7% |
| Assyrians/Chaldeans/Syriacs | 5.9 /100 | #228 | Tragic 1.7% |
| Colville | 4.7 /100 | #229 | Tragic 1.6% |
| Immigrants | Philippines | 4.3 /100 | #230 | Tragic 1.6% |
| Immigrants | North Macedonia | 3.9 /100 | #231 | Tragic 1.6% |
| Guamanians/Chamorros | 3.3 /100 | #232 | Tragic 1.6% |
| Barbadians | 3.3 /100 | #233 | Tragic 1.6% |
| Hopi | 3.2 /100 | #234 | Tragic 1.6% |
| Cree | 3.0 /100 | #235 | Tragic 1.6% |
Demographics Similar to Immigrants from Ecuador by Doctorate Degree
In terms of doctorate degree, the demographic groups most similar to Immigrants from Ecuador are Tsimshian (1.4%, a difference of 0.22%), Guatemalan (1.4%, a difference of 0.23%), Puerto Rican (1.4%, a difference of 0.63%), Samoan (1.4%, a difference of 0.94%), and Belizean (1.4%, a difference of 1.1%).
| Demographics | Rating | Rank | Doctorate Degree |
| Cape Verdeans | 0.3 /100 | #289 | Tragic 1.4% |
| Choctaw | 0.3 /100 | #290 | Tragic 1.4% |
| Blacks/African Americans | 0.3 /100 | #291 | Tragic 1.4% |
| Alaska Natives | 0.3 /100 | #292 | Tragic 1.4% |
| Immigrants | Yemen | 0.2 /100 | #293 | Tragic 1.4% |
| Samoans | 0.2 /100 | #294 | Tragic 1.4% |
| Guatemalans | 0.2 /100 | #295 | Tragic 1.4% |
| Immigrants | Ecuador | 0.2 /100 | #296 | Tragic 1.4% |
| Tsimshian | 0.2 /100 | #297 | Tragic 1.4% |
| Puerto Ricans | 0.1 /100 | #298 | Tragic 1.4% |
| Belizeans | 0.1 /100 | #299 | Tragic 1.4% |
| Immigrants | Guatemala | 0.1 /100 | #300 | Tragic 1.4% |
| Hondurans | 0.1 /100 | #301 | Tragic 1.4% |
| Shoshone | 0.1 /100 | #302 | Tragic 1.4% |
| Immigrants | Dominica | 0.1 /100 | #303 | Tragic 1.4% |