Assyrian/Chaldean/Syriac vs British West Indian Doctorate Degree
COMPARE
Assyrian/Chaldean/Syriac
British West Indian
Doctorate Degree
Doctorate Degree Comparison
Assyrians/Chaldeans/Syriacs
British West Indians
1.7%
DOCTORATE DEGREE
5.9/ 100
METRIC RATING
228th/ 347
METRIC RANK
1.5%
DOCTORATE DEGREE
0.3/ 100
METRIC RATING
282nd/ 347
METRIC RANK
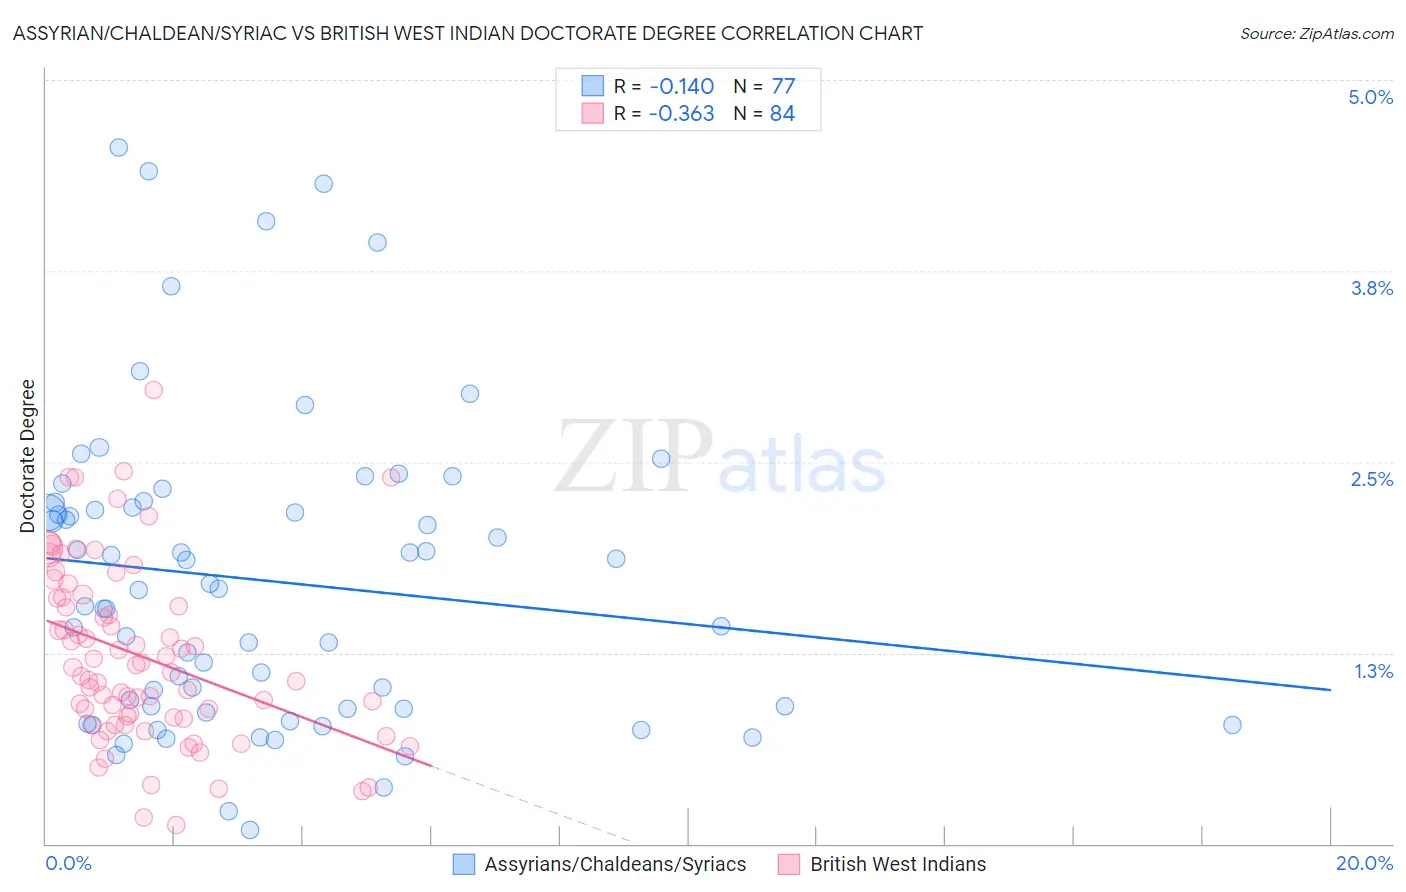
Assyrian/Chaldean/Syriac vs British West Indian Doctorate Degree Correlation Chart
The statistical analysis conducted on geographies consisting of 110,001,704 people shows a poor negative correlation between the proportion of Assyrians/Chaldeans/Syriacs and percentage of population with at least doctorate degree education in the United States with a correlation coefficient (R) of -0.140 and weighted average of 1.7%. Similarly, the statistical analysis conducted on geographies consisting of 152,241,943 people shows a mild negative correlation between the proportion of British West Indians and percentage of population with at least doctorate degree education in the United States with a correlation coefficient (R) of -0.363 and weighted average of 1.5%, a difference of 13.4%.
Doctorate Degree Correlation Summary
| Measurement | Assyrian/Chaldean/Syriac | British West Indian |
| Minimum | 0.087% | 0.12% |
| Maximum | 4.6% | 3.0% |
| Range | 4.5% | 2.8% |
| Mean | 1.7% | 1.2% |
| Median | 1.7% | 1.1% |
| Interquartile 25% (IQ1) | 0.88% | 0.82% |
| Interquartile 75% (IQ3) | 2.2% | 1.6% |
| Interquartile Range (IQR) | 1.3% | 0.79% |
| Standard Deviation (Sample) | 1.0% | 0.58% |
| Standard Deviation (Population) | 1.00% | 0.58% |
Similar Demographics by Doctorate Degree
Demographics Similar to Assyrians/Chaldeans/Syriacs by Doctorate Degree
In terms of doctorate degree, the demographic groups most similar to Assyrians/Chaldeans/Syriacs are Panamanian (1.7%, a difference of 0.28%), Osage (1.7%, a difference of 0.42%), Immigrants from Colombia (1.7%, a difference of 0.53%), Colville (1.6%, a difference of 1.0%), and Immigrants from Poland (1.7%, a difference of 1.0%).
| Demographics | Rating | Rank | Doctorate Degree |
| Immigrants | Nonimmigrants | 8.8 /100 | #221 | Tragic 1.7% |
| Immigrants | Venezuela | 8.7 /100 | #222 | Tragic 1.7% |
| Immigrants | Bosnia and Herzegovina | 7.8 /100 | #223 | Tragic 1.7% |
| Immigrants | Poland | 7.4 /100 | #224 | Tragic 1.7% |
| Immigrants | Colombia | 6.7 /100 | #225 | Tragic 1.7% |
| Osage | 6.5 /100 | #226 | Tragic 1.7% |
| Panamanians | 6.3 /100 | #227 | Tragic 1.7% |
| Assyrians/Chaldeans/Syriacs | 5.9 /100 | #228 | Tragic 1.7% |
| Colville | 4.7 /100 | #229 | Tragic 1.6% |
| Immigrants | Philippines | 4.3 /100 | #230 | Tragic 1.6% |
| Immigrants | North Macedonia | 3.9 /100 | #231 | Tragic 1.6% |
| Guamanians/Chamorros | 3.3 /100 | #232 | Tragic 1.6% |
| Barbadians | 3.3 /100 | #233 | Tragic 1.6% |
| Hopi | 3.2 /100 | #234 | Tragic 1.6% |
| Cree | 3.0 /100 | #235 | Tragic 1.6% |
Demographics Similar to British West Indians by Doctorate Degree
In terms of doctorate degree, the demographic groups most similar to British West Indians are Tohono O'odham (1.5%, a difference of 0.050%), Central American (1.5%, a difference of 0.050%), Jamaican (1.5%, a difference of 0.090%), Malaysian (1.5%, a difference of 0.11%), and Ecuadorian (1.5%, a difference of 0.12%).
| Demographics | Rating | Rank | Doctorate Degree |
| Aleuts | 0.4 /100 | #275 | Tragic 1.5% |
| Paiute | 0.4 /100 | #276 | Tragic 1.5% |
| Bahamians | 0.4 /100 | #277 | Tragic 1.5% |
| Hawaiians | 0.4 /100 | #278 | Tragic 1.5% |
| Marshallese | 0.4 /100 | #279 | Tragic 1.5% |
| Ecuadorians | 0.4 /100 | #280 | Tragic 1.5% |
| Tohono O'odham | 0.4 /100 | #281 | Tragic 1.5% |
| British West Indians | 0.3 /100 | #282 | Tragic 1.5% |
| Central Americans | 0.3 /100 | #283 | Tragic 1.5% |
| Jamaicans | 0.3 /100 | #284 | Tragic 1.5% |
| Malaysians | 0.3 /100 | #285 | Tragic 1.5% |
| Cherokee | 0.3 /100 | #286 | Tragic 1.5% |
| Cajuns | 0.3 /100 | #287 | Tragic 1.5% |
| Immigrants | El Salvador | 0.3 /100 | #288 | Tragic 1.4% |
| Cape Verdeans | 0.3 /100 | #289 | Tragic 1.4% |