Armenian vs Immigrants from Norway Doctorate Degree
COMPARE
Armenian
Immigrants from Norway
Doctorate Degree
Doctorate Degree Comparison
Armenians
Immigrants from Norway
2.1%
DOCTORATE DEGREE
98.3/ 100
METRIC RATING
98th/ 347
METRIC RANK
2.4%
DOCTORATE DEGREE
100.0/ 100
METRIC RATING
50th/ 347
METRIC RANK
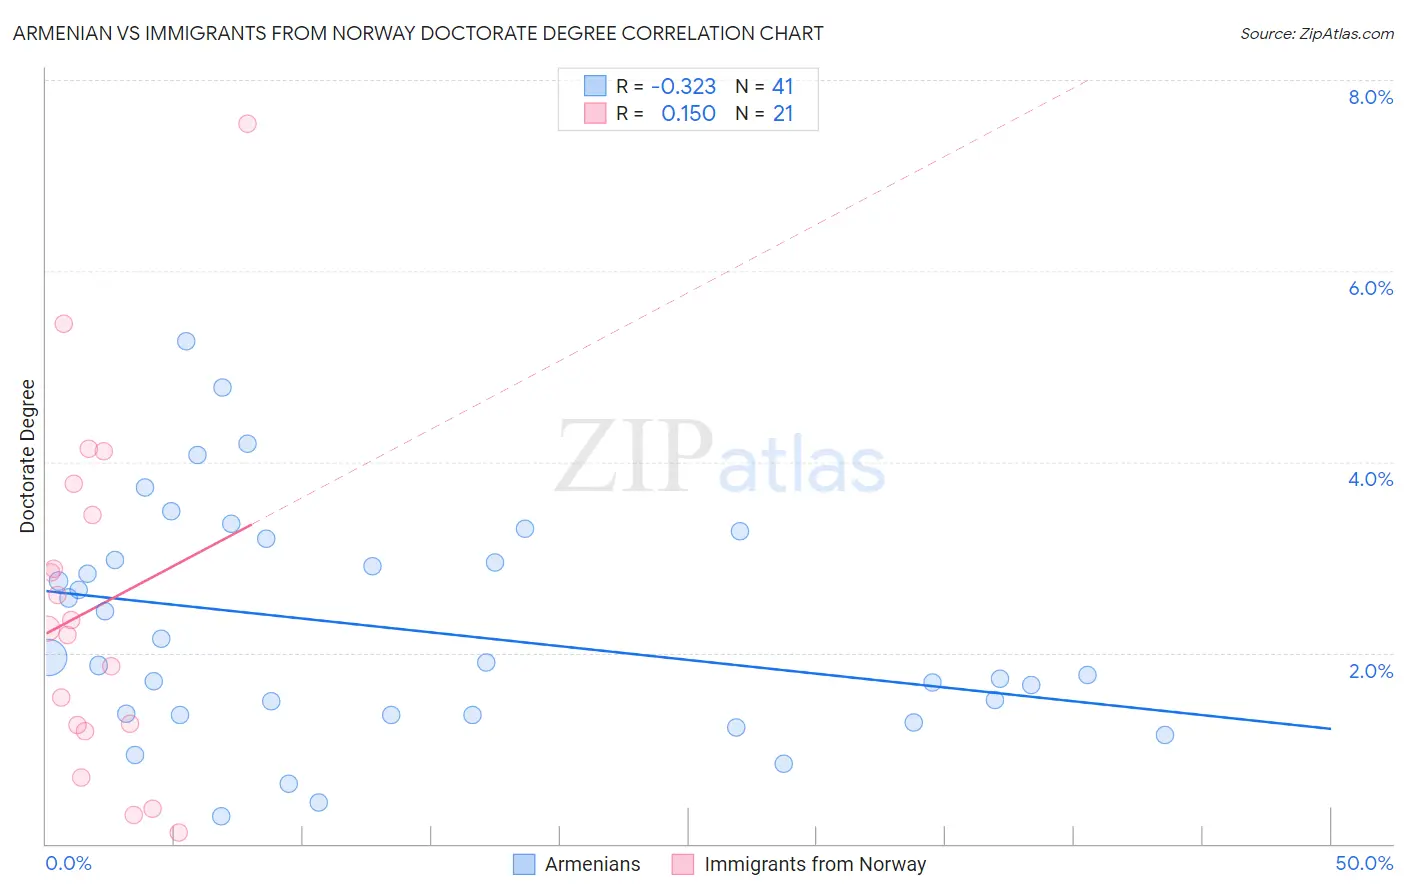
Armenian vs Immigrants from Norway Doctorate Degree Correlation Chart
The statistical analysis conducted on geographies consisting of 309,311,130 people shows a mild negative correlation between the proportion of Armenians and percentage of population with at least doctorate degree education in the United States with a correlation coefficient (R) of -0.323 and weighted average of 2.1%. Similarly, the statistical analysis conducted on geographies consisting of 116,506,510 people shows a poor positive correlation between the proportion of Immigrants from Norway and percentage of population with at least doctorate degree education in the United States with a correlation coefficient (R) of 0.150 and weighted average of 2.4%, a difference of 13.5%.
Doctorate Degree Correlation Summary
| Measurement | Armenian | Immigrants from Norway |
| Minimum | 0.29% | 0.12% |
| Maximum | 5.3% | 7.5% |
| Range | 5.0% | 7.4% |
| Mean | 2.3% | 2.5% |
| Median | 1.9% | 2.3% |
| Interquartile 25% (IQ1) | 1.4% | 1.2% |
| Interquartile 75% (IQ3) | 3.1% | 3.6% |
| Interquartile Range (IQR) | 1.7% | 2.4% |
| Standard Deviation (Sample) | 1.2% | 1.8% |
| Standard Deviation (Population) | 1.2% | 1.8% |
Similar Demographics by Doctorate Degree
Demographics Similar to Armenians by Doctorate Degree
In terms of doctorate degree, the demographic groups most similar to Armenians are Immigrants from Eritrea (2.1%, a difference of 0.080%), Immigrants from Egypt (2.1%, a difference of 0.18%), Immigrants from Eastern Europe (2.1%, a difference of 0.18%), Immigrants from Northern Africa (2.1%, a difference of 0.21%), and Immigrants from Eastern Africa (2.1%, a difference of 0.21%).
| Demographics | Rating | Rank | Doctorate Degree |
| Immigrants | Sudan | 99.1 /100 | #91 | Exceptional 2.2% |
| Chileans | 99.1 /100 | #92 | Exceptional 2.2% |
| Alsatians | 99.0 /100 | #93 | Exceptional 2.1% |
| Greeks | 98.8 /100 | #94 | Exceptional 2.1% |
| Immigrants | Romania | 98.7 /100 | #95 | Exceptional 2.1% |
| Immigrants | Northern Africa | 98.4 /100 | #96 | Exceptional 2.1% |
| Immigrants | Eritrea | 98.4 /100 | #97 | Exceptional 2.1% |
| Armenians | 98.3 /100 | #98 | Exceptional 2.1% |
| Immigrants | Egypt | 98.2 /100 | #99 | Exceptional 2.1% |
| Immigrants | Eastern Europe | 98.2 /100 | #100 | Exceptional 2.1% |
| Immigrants | Eastern Africa | 98.2 /100 | #101 | Exceptional 2.1% |
| Immigrants | Chile | 98.1 /100 | #102 | Exceptional 2.1% |
| Romanians | 98.1 /100 | #103 | Exceptional 2.1% |
| Austrians | 98.0 /100 | #104 | Exceptional 2.1% |
| Arabs | 97.8 /100 | #105 | Exceptional 2.1% |
Demographics Similar to Immigrants from Norway by Doctorate Degree
In terms of doctorate degree, the demographic groups most similar to Immigrants from Norway are Australian (2.4%, a difference of 0.090%), Bulgarian (2.4%, a difference of 0.56%), Immigrants from Latvia (2.4%, a difference of 0.68%), Immigrants from Asia (2.4%, a difference of 1.1%), and Asian (2.4%, a difference of 1.3%).
| Demographics | Rating | Rank | Doctorate Degree |
| Soviet Union | 100.0 /100 | #43 | Exceptional 2.5% |
| Immigrants | Netherlands | 100.0 /100 | #44 | Exceptional 2.5% |
| Immigrants | South Africa | 100.0 /100 | #45 | Exceptional 2.4% |
| Immigrants | Austria | 100.0 /100 | #46 | Exceptional 2.4% |
| Immigrants | Western Europe | 100.0 /100 | #47 | Exceptional 2.4% |
| Asians | 100.0 /100 | #48 | Exceptional 2.4% |
| Immigrants | Asia | 100.0 /100 | #49 | Exceptional 2.4% |
| Immigrants | Norway | 100.0 /100 | #50 | Exceptional 2.4% |
| Australians | 100.0 /100 | #51 | Exceptional 2.4% |
| Bulgarians | 100.0 /100 | #52 | Exceptional 2.4% |
| Immigrants | Latvia | 100.0 /100 | #53 | Exceptional 2.4% |
| Immigrants | Indonesia | 100.0 /100 | #54 | Exceptional 2.4% |
| Bolivians | 100.0 /100 | #55 | Exceptional 2.4% |
| Immigrants | Czechoslovakia | 100.0 /100 | #56 | Exceptional 2.4% |
| Immigrants | Ethiopia | 100.0 /100 | #57 | Exceptional 2.4% |