Armenian vs Immigrants from Morocco Doctorate Degree
COMPARE
Armenian
Immigrants from Morocco
Doctorate Degree
Doctorate Degree Comparison
Armenians
Immigrants from Morocco
2.1%
DOCTORATE DEGREE
98.3/ 100
METRIC RATING
98th/ 347
METRIC RANK
2.0%
DOCTORATE DEGREE
95.5/ 100
METRIC RATING
120th/ 347
METRIC RANK
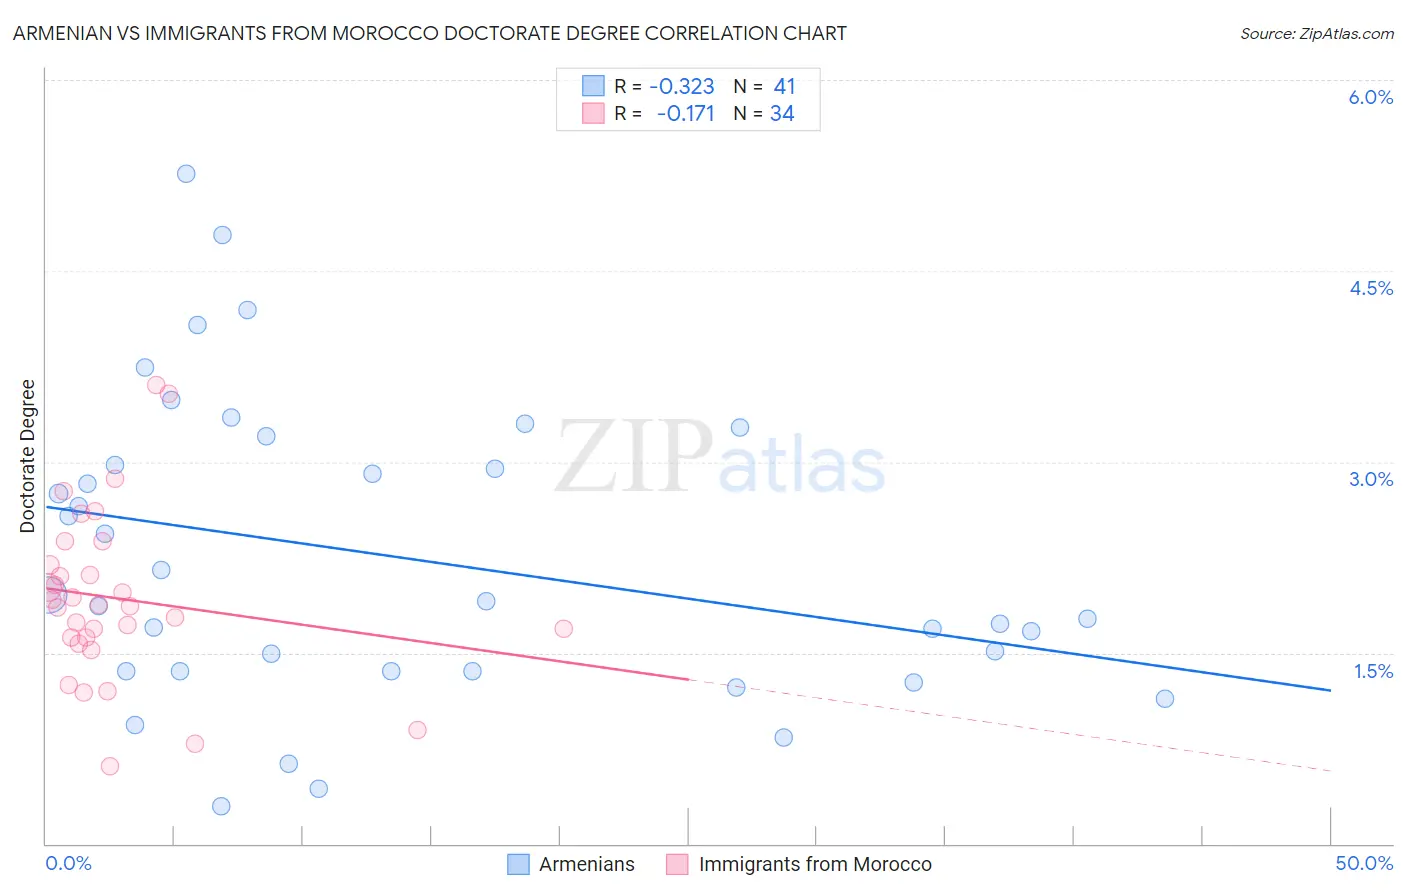
Armenian vs Immigrants from Morocco Doctorate Degree Correlation Chart
The statistical analysis conducted on geographies consisting of 309,311,130 people shows a mild negative correlation between the proportion of Armenians and percentage of population with at least doctorate degree education in the United States with a correlation coefficient (R) of -0.323 and weighted average of 2.1%. Similarly, the statistical analysis conducted on geographies consisting of 178,707,099 people shows a poor negative correlation between the proportion of Immigrants from Morocco and percentage of population with at least doctorate degree education in the United States with a correlation coefficient (R) of -0.171 and weighted average of 2.0%, a difference of 3.4%.
Doctorate Degree Correlation Summary
| Measurement | Armenian | Immigrants from Morocco |
| Minimum | 0.29% | 0.60% |
| Maximum | 5.3% | 3.6% |
| Range | 5.0% | 3.0% |
| Mean | 2.3% | 1.9% |
| Median | 1.9% | 1.9% |
| Interquartile 25% (IQ1) | 1.4% | 1.6% |
| Interquartile 75% (IQ3) | 3.1% | 2.2% |
| Interquartile Range (IQR) | 1.7% | 0.57% |
| Standard Deviation (Sample) | 1.2% | 0.67% |
| Standard Deviation (Population) | 1.2% | 0.66% |
Similar Demographics by Doctorate Degree
Demographics Similar to Armenians by Doctorate Degree
In terms of doctorate degree, the demographic groups most similar to Armenians are Immigrants from Eritrea (2.1%, a difference of 0.080%), Immigrants from Egypt (2.1%, a difference of 0.18%), Immigrants from Eastern Europe (2.1%, a difference of 0.18%), Immigrants from Northern Africa (2.1%, a difference of 0.21%), and Immigrants from Eastern Africa (2.1%, a difference of 0.21%).
| Demographics | Rating | Rank | Doctorate Degree |
| Immigrants | Sudan | 99.1 /100 | #91 | Exceptional 2.2% |
| Chileans | 99.1 /100 | #92 | Exceptional 2.2% |
| Alsatians | 99.0 /100 | #93 | Exceptional 2.1% |
| Greeks | 98.8 /100 | #94 | Exceptional 2.1% |
| Immigrants | Romania | 98.7 /100 | #95 | Exceptional 2.1% |
| Immigrants | Northern Africa | 98.4 /100 | #96 | Exceptional 2.1% |
| Immigrants | Eritrea | 98.4 /100 | #97 | Exceptional 2.1% |
| Armenians | 98.3 /100 | #98 | Exceptional 2.1% |
| Immigrants | Egypt | 98.2 /100 | #99 | Exceptional 2.1% |
| Immigrants | Eastern Europe | 98.2 /100 | #100 | Exceptional 2.1% |
| Immigrants | Eastern Africa | 98.2 /100 | #101 | Exceptional 2.1% |
| Immigrants | Chile | 98.1 /100 | #102 | Exceptional 2.1% |
| Romanians | 98.1 /100 | #103 | Exceptional 2.1% |
| Austrians | 98.0 /100 | #104 | Exceptional 2.1% |
| Arabs | 97.8 /100 | #105 | Exceptional 2.1% |
Demographics Similar to Immigrants from Morocco by Doctorate Degree
In terms of doctorate degree, the demographic groups most similar to Immigrants from Morocco are Pakistani (2.0%, a difference of 0.28%), Icelander (2.1%, a difference of 0.42%), Lebanese (2.1%, a difference of 0.45%), Immigrants from Jordan (2.0%, a difference of 0.48%), and Immigrants from Southern Europe (2.0%, a difference of 0.50%).
| Demographics | Rating | Rank | Doctorate Degree |
| Immigrants | Italy | 96.9 /100 | #113 | Exceptional 2.1% |
| Immigrants | Croatia | 96.8 /100 | #114 | Exceptional 2.1% |
| Taiwanese | 96.7 /100 | #115 | Exceptional 2.1% |
| Maltese | 96.2 /100 | #116 | Exceptional 2.1% |
| Lebanese | 96.0 /100 | #117 | Exceptional 2.1% |
| Icelanders | 96.0 /100 | #118 | Exceptional 2.1% |
| Pakistanis | 95.8 /100 | #119 | Exceptional 2.0% |
| Immigrants | Morocco | 95.5 /100 | #120 | Exceptional 2.0% |
| Immigrants | Jordan | 94.8 /100 | #121 | Exceptional 2.0% |
| Immigrants | Southern Europe | 94.7 /100 | #122 | Exceptional 2.0% |
| Croatians | 94.0 /100 | #123 | Exceptional 2.0% |
| Ute | 93.2 /100 | #124 | Exceptional 2.0% |
| Moroccans | 93.0 /100 | #125 | Exceptional 2.0% |
| Jordanians | 92.1 /100 | #126 | Exceptional 2.0% |
| Palestinians | 92.0 /100 | #127 | Exceptional 2.0% |