Arapaho vs Cherokee Doctorate Degree
COMPARE
Arapaho
Cherokee
Doctorate Degree
Doctorate Degree Comparison
Arapaho
Cherokee
1.2%
DOCTORATE DEGREE
0.0/ 100
METRIC RATING
342nd/ 347
METRIC RANK
1.5%
DOCTORATE DEGREE
0.3/ 100
METRIC RATING
286th/ 347
METRIC RANK
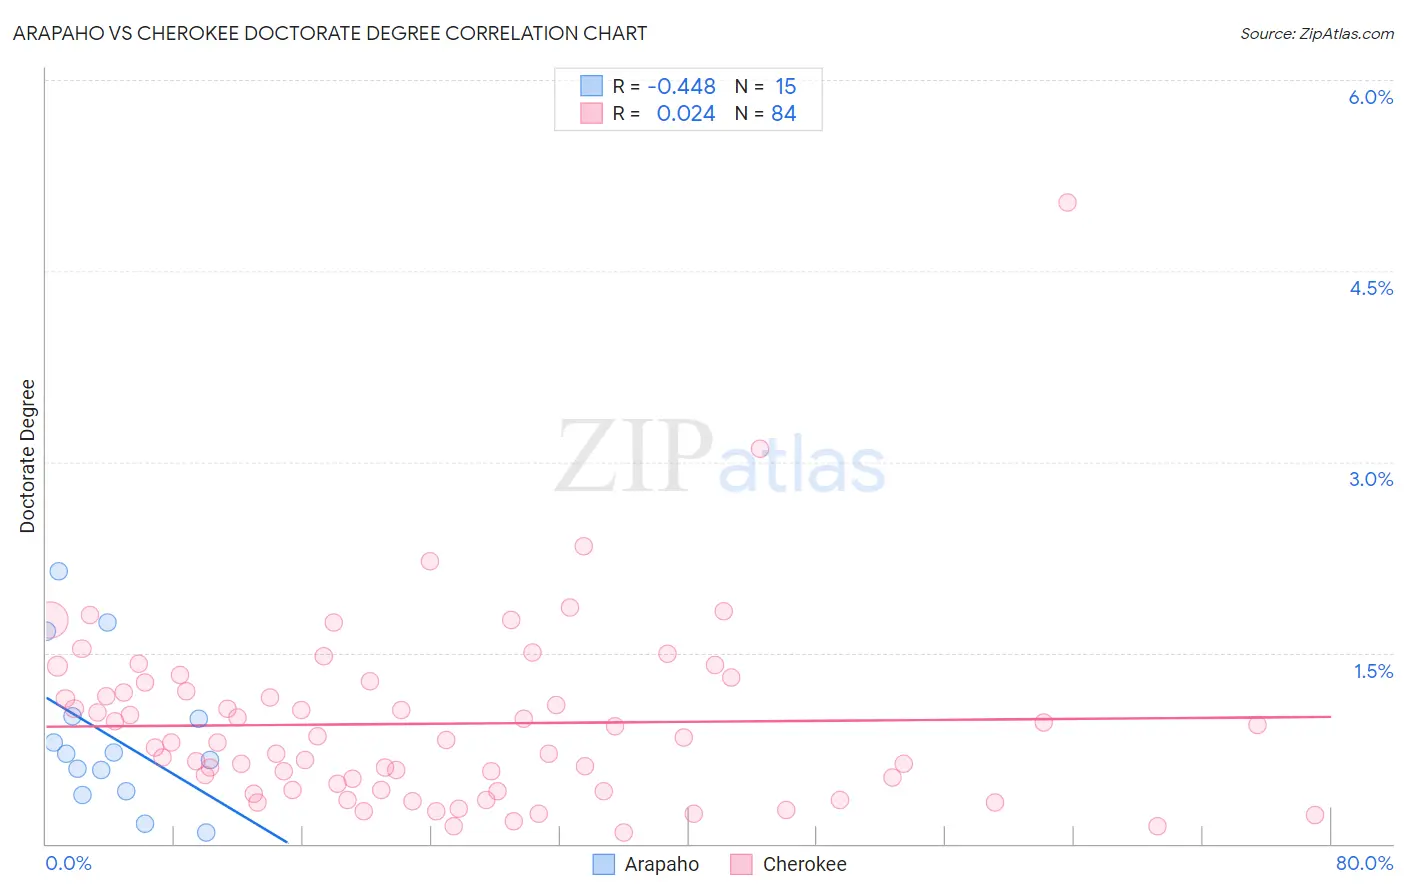
Arapaho vs Cherokee Doctorate Degree Correlation Chart
The statistical analysis conducted on geographies consisting of 29,522,759 people shows a moderate negative correlation between the proportion of Arapaho and percentage of population with at least doctorate degree education in the United States with a correlation coefficient (R) of -0.448 and weighted average of 1.2%. Similarly, the statistical analysis conducted on geographies consisting of 478,818,263 people shows no correlation between the proportion of Cherokee and percentage of population with at least doctorate degree education in the United States with a correlation coefficient (R) of 0.024 and weighted average of 1.5%, a difference of 24.5%.
Doctorate Degree Correlation Summary
| Measurement | Arapaho | Cherokee |
| Minimum | 0.090% | 0.091% |
| Maximum | 2.1% | 5.0% |
| Range | 2.0% | 5.0% |
| Mean | 0.84% | 0.94% |
| Median | 0.71% | 0.81% |
| Interquartile 25% (IQ1) | 0.41% | 0.43% |
| Interquartile 75% (IQ3) | 1.0% | 1.2% |
| Interquartile Range (IQR) | 0.59% | 0.81% |
| Standard Deviation (Sample) | 0.59% | 0.73% |
| Standard Deviation (Population) | 0.57% | 0.72% |
Similar Demographics by Doctorate Degree
Demographics Similar to Arapaho by Doctorate Degree
In terms of doctorate degree, the demographic groups most similar to Arapaho are Mexican (1.2%, a difference of 0.38%), Immigrants from Cuba (1.2%, a difference of 0.86%), Immigrants from Central America (1.2%, a difference of 1.7%), Puget Sound Salish (1.2%, a difference of 3.0%), and Fijian (1.1%, a difference of 3.4%).
| Demographics | Rating | Rank | Doctorate Degree |
| Immigrants | Caribbean | 0.0 /100 | #333 | Tragic 1.3% |
| Immigrants | Dominican Republic | 0.0 /100 | #334 | Tragic 1.3% |
| Immigrants | Haiti | 0.0 /100 | #335 | Tragic 1.3% |
| Nepalese | 0.0 /100 | #336 | Tragic 1.3% |
| Bangladeshis | 0.0 /100 | #337 | Tragic 1.2% |
| Puget Sound Salish | 0.0 /100 | #338 | Tragic 1.2% |
| Immigrants | Central America | 0.0 /100 | #339 | Tragic 1.2% |
| Immigrants | Cuba | 0.0 /100 | #340 | Tragic 1.2% |
| Mexicans | 0.0 /100 | #341 | Tragic 1.2% |
| Arapaho | 0.0 /100 | #342 | Tragic 1.2% |
| Fijians | 0.0 /100 | #343 | Tragic 1.1% |
| Immigrants | Mexico | 0.0 /100 | #344 | Tragic 1.1% |
| Lumbee | 0.0 /100 | #345 | Tragic 1.1% |
| Spanish American Indians | 0.0 /100 | #346 | Tragic 1.1% |
| Houma | 0.0 /100 | #347 | Tragic 0.96% |
Demographics Similar to Cherokee by Doctorate Degree
In terms of doctorate degree, the demographic groups most similar to Cherokee are Cajun (1.5%, a difference of 0.17%), Malaysian (1.5%, a difference of 0.18%), Jamaican (1.5%, a difference of 0.21%), Central American (1.5%, a difference of 0.24%), and British West Indian (1.5%, a difference of 0.29%).
| Demographics | Rating | Rank | Doctorate Degree |
| Marshallese | 0.4 /100 | #279 | Tragic 1.5% |
| Ecuadorians | 0.4 /100 | #280 | Tragic 1.5% |
| Tohono O'odham | 0.4 /100 | #281 | Tragic 1.5% |
| British West Indians | 0.3 /100 | #282 | Tragic 1.5% |
| Central Americans | 0.3 /100 | #283 | Tragic 1.5% |
| Jamaicans | 0.3 /100 | #284 | Tragic 1.5% |
| Malaysians | 0.3 /100 | #285 | Tragic 1.5% |
| Cherokee | 0.3 /100 | #286 | Tragic 1.5% |
| Cajuns | 0.3 /100 | #287 | Tragic 1.5% |
| Immigrants | El Salvador | 0.3 /100 | #288 | Tragic 1.4% |
| Cape Verdeans | 0.3 /100 | #289 | Tragic 1.4% |
| Choctaw | 0.3 /100 | #290 | Tragic 1.4% |
| Blacks/African Americans | 0.3 /100 | #291 | Tragic 1.4% |
| Alaska Natives | 0.3 /100 | #292 | Tragic 1.4% |
| Immigrants | Yemen | 0.2 /100 | #293 | Tragic 1.4% |