Yuman vs Polish Male Disability
COMPARE
Yuman
Polish
Male Disability
Male Disability Comparison
Yuman
Poles
14.7%
MALE DISABILITY
0.0/ 100
METRIC RATING
333rd/ 347
METRIC RANK
12.0%
MALE DISABILITY
0.7/ 100
METRIC RATING
248th/ 347
METRIC RANK
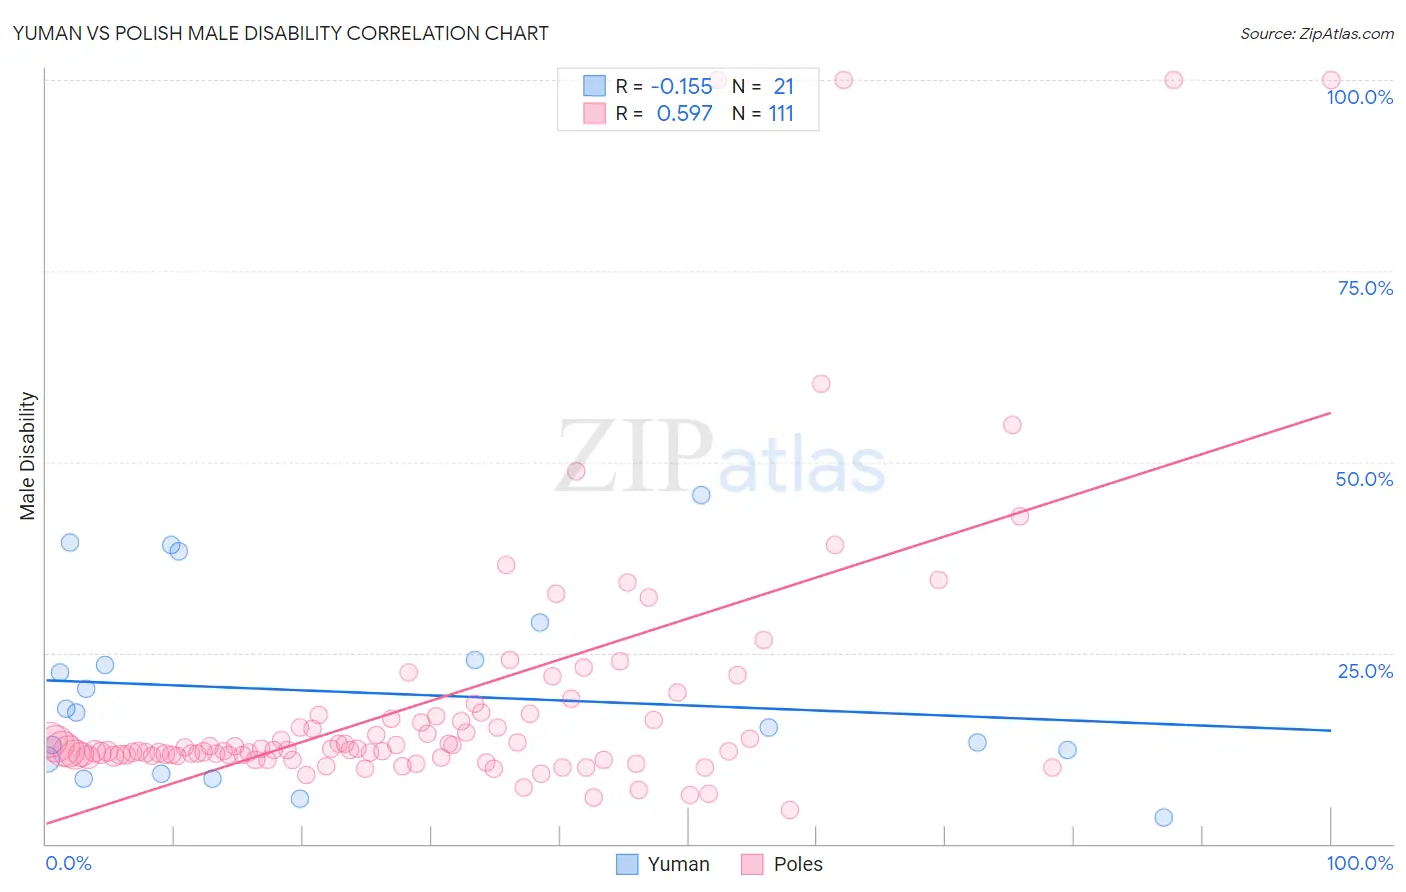
Yuman vs Polish Male Disability Correlation Chart
The statistical analysis conducted on geographies consisting of 40,663,251 people shows a poor negative correlation between the proportion of Yuman and percentage of males with a disability in the United States with a correlation coefficient (R) of -0.155 and weighted average of 14.7%. Similarly, the statistical analysis conducted on geographies consisting of 560,313,997 people shows a substantial positive correlation between the proportion of Poles and percentage of males with a disability in the United States with a correlation coefficient (R) of 0.597 and weighted average of 12.0%, a difference of 23.0%.
Male Disability Correlation Summary
| Measurement | Yuman | Polish |
| Minimum | 3.4% | 4.3% |
| Maximum | 45.6% | 100.0% |
| Range | 42.1% | 95.7% |
| Mean | 19.8% | 18.7% |
| Median | 17.1% | 12.3% |
| Interquartile 25% (IQ1) | 10.1% | 11.5% |
| Interquartile 75% (IQ3) | 26.5% | 16.7% |
| Interquartile Range (IQR) | 16.4% | 5.2% |
| Standard Deviation (Sample) | 12.2% | 18.4% |
| Standard Deviation (Population) | 11.9% | 18.3% |
Similar Demographics by Male Disability
Demographics Similar to Yuman by Male Disability
In terms of male disability, the demographic groups most similar to Yuman are Seminole (14.7%, a difference of 0.10%), Cherokee (14.8%, a difference of 0.68%), Dutch West Indian (14.8%, a difference of 0.70%), Tohono O'odham (14.6%, a difference of 0.87%), and Alaskan Athabascan (14.9%, a difference of 1.2%).
| Demographics | Rating | Rank | Male Disability |
| Natives/Alaskans | 0.0 /100 | #326 | Tragic 14.2% |
| Potawatomi | 0.0 /100 | #327 | Tragic 14.2% |
| Chippewa | 0.0 /100 | #328 | Tragic 14.3% |
| Cajuns | 0.0 /100 | #329 | Tragic 14.4% |
| Navajo | 0.0 /100 | #330 | Tragic 14.4% |
| Tohono O'odham | 0.0 /100 | #331 | Tragic 14.6% |
| Seminole | 0.0 /100 | #332 | Tragic 14.7% |
| Yuman | 0.0 /100 | #333 | Tragic 14.7% |
| Cherokee | 0.0 /100 | #334 | Tragic 14.8% |
| Dutch West Indians | 0.0 /100 | #335 | Tragic 14.8% |
| Alaskan Athabascans | 0.0 /100 | #336 | Tragic 14.9% |
| Menominee | 0.0 /100 | #337 | Tragic 15.0% |
| Pueblo | 0.0 /100 | #338 | Tragic 15.0% |
| Chickasaw | 0.0 /100 | #339 | Tragic 15.1% |
| Lumbee | 0.0 /100 | #340 | Tragic 15.2% |
Demographics Similar to Poles by Male Disability
In terms of male disability, the demographic groups most similar to Poles are Hungarian (12.0%, a difference of 0.18%), Danish (11.9%, a difference of 0.36%), Immigrants from Yemen (12.0%, a difference of 0.36%), Immigrants from Laos (11.9%, a difference of 0.40%), and Immigrants from Liberia (11.9%, a difference of 0.40%).
| Demographics | Rating | Rank | Male Disability |
| Bahamians | 1.1 /100 | #241 | Tragic 11.9% |
| Northern Europeans | 1.1 /100 | #242 | Tragic 11.9% |
| Samoans | 1.1 /100 | #243 | Tragic 11.9% |
| Immigrants | Laos | 1.0 /100 | #244 | Tragic 11.9% |
| Immigrants | Liberia | 1.0 /100 | #245 | Tragic 11.9% |
| Danes | 0.9 /100 | #246 | Tragic 11.9% |
| Hungarians | 0.8 /100 | #247 | Tragic 12.0% |
| Poles | 0.7 /100 | #248 | Tragic 12.0% |
| Immigrants | Yemen | 0.5 /100 | #249 | Tragic 12.0% |
| Bangladeshis | 0.5 /100 | #250 | Tragic 12.0% |
| German Russians | 0.5 /100 | #251 | Tragic 12.0% |
| Slovenes | 0.5 /100 | #252 | Tragic 12.0% |
| Guamanians/Chamorros | 0.5 /100 | #253 | Tragic 12.0% |
| British | 0.4 /100 | #254 | Tragic 12.1% |
| Chinese | 0.4 /100 | #255 | Tragic 12.1% |