Yaqui vs Swiss Disability Age 35 to 64
COMPARE
Yaqui
Swiss
Disability Age 35 to 64
Disability Age 35 to 64 Comparison
Yaqui
Swiss
13.5%
DISABILITY AGE 35 TO 64
0.0/ 100
METRIC RATING
294th/ 347
METRIC RANK
11.6%
DISABILITY AGE 35 TO 64
18.7/ 100
METRIC RATING
200th/ 347
METRIC RANK
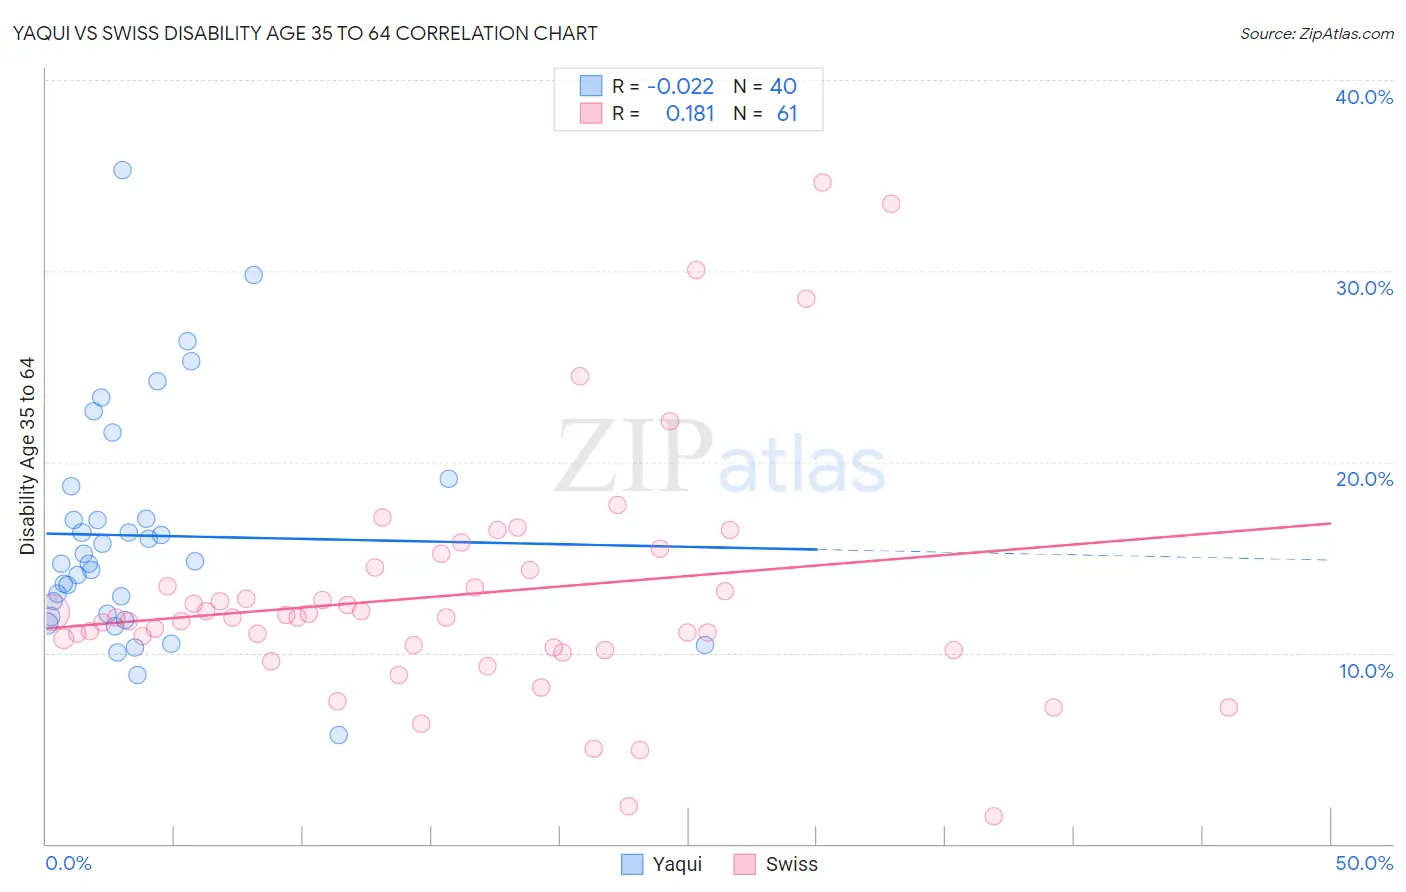
Yaqui vs Swiss Disability Age 35 to 64 Correlation Chart
The statistical analysis conducted on geographies consisting of 107,720,635 people shows no correlation between the proportion of Yaqui and percentage of population with a disability between the ages 34 and 64 in the United States with a correlation coefficient (R) of -0.022 and weighted average of 13.5%. Similarly, the statistical analysis conducted on geographies consisting of 464,639,334 people shows a poor positive correlation between the proportion of Swiss and percentage of population with a disability between the ages 34 and 64 in the United States with a correlation coefficient (R) of 0.181 and weighted average of 11.6%, a difference of 16.0%.
Disability Age 35 to 64 Correlation Summary
| Measurement | Yaqui | Swiss |
| Minimum | 5.7% | 1.5% |
| Maximum | 35.3% | 34.6% |
| Range | 29.6% | 33.2% |
| Mean | 16.1% | 13.0% |
| Median | 14.8% | 11.8% |
| Interquartile 25% (IQ1) | 12.0% | 10.2% |
| Interquartile 75% (IQ3) | 17.9% | 14.4% |
| Interquartile Range (IQR) | 5.9% | 4.2% |
| Standard Deviation (Sample) | 6.0% | 6.4% |
| Standard Deviation (Population) | 5.9% | 6.3% |
Similar Demographics by Disability Age 35 to 64
Demographics Similar to Yaqui by Disability Age 35 to 64
In terms of disability age 35 to 64, the demographic groups most similar to Yaqui are Ute (13.4%, a difference of 0.58%), Yakama (13.6%, a difference of 0.68%), African (13.6%, a difference of 0.90%), Puget Sound Salish (13.3%, a difference of 1.1%), and Immigrants from Congo (13.3%, a difference of 1.1%).
| Demographics | Rating | Rank | Disability Age 35 to 64 |
| Tlingit-Haida | 0.0 /100 | #287 | Tragic 13.2% |
| Fijians | 0.0 /100 | #288 | Tragic 13.2% |
| Indonesians | 0.0 /100 | #289 | Tragic 13.2% |
| Immigrants | Liberia | 0.0 /100 | #290 | Tragic 13.2% |
| Immigrants | Congo | 0.0 /100 | #291 | Tragic 13.3% |
| Puget Sound Salish | 0.0 /100 | #292 | Tragic 13.3% |
| Ute | 0.0 /100 | #293 | Tragic 13.4% |
| Yaqui | 0.0 /100 | #294 | Tragic 13.5% |
| Yakama | 0.0 /100 | #295 | Tragic 13.6% |
| Africans | 0.0 /100 | #296 | Tragic 13.6% |
| Bangladeshis | 0.0 /100 | #297 | Tragic 13.6% |
| Cheyenne | 0.0 /100 | #298 | Tragic 13.6% |
| Spanish Americans | 0.0 /100 | #299 | Tragic 13.7% |
| Delaware | 0.0 /100 | #300 | Tragic 13.7% |
| French American Indians | 0.0 /100 | #301 | Tragic 13.7% |
Demographics Similar to Swiss by Disability Age 35 to 64
In terms of disability age 35 to 64, the demographic groups most similar to Swiss are Basque (11.6%, a difference of 0.10%), Immigrants from Kenya (11.6%, a difference of 0.13%), Immigrants from Guatemala (11.6%, a difference of 0.15%), Immigrants from Panama (11.6%, a difference of 0.21%), and British (11.6%, a difference of 0.22%).
| Demographics | Rating | Rank | Disability Age 35 to 64 |
| Immigrants | Africa | 29.0 /100 | #193 | Fair 11.5% |
| Immigrants | Latin America | 27.5 /100 | #194 | Fair 11.5% |
| Carpatho Rusyns | 25.3 /100 | #195 | Fair 11.5% |
| Iraqis | 24.2 /100 | #196 | Fair 11.5% |
| Immigrants | Iraq | 21.0 /100 | #197 | Fair 11.6% |
| Immigrants | Panama | 20.4 /100 | #198 | Fair 11.6% |
| Basques | 19.5 /100 | #199 | Poor 11.6% |
| Swiss | 18.7 /100 | #200 | Poor 11.6% |
| Immigrants | Kenya | 17.7 /100 | #201 | Poor 11.6% |
| Immigrants | Guatemala | 17.5 /100 | #202 | Poor 11.6% |
| British | 17.0 /100 | #203 | Poor 11.6% |
| Nigerians | 16.3 /100 | #204 | Poor 11.6% |
| Slavs | 15.5 /100 | #205 | Poor 11.7% |
| Native Hawaiians | 14.8 /100 | #206 | Poor 11.7% |
| Ghanaians | 14.8 /100 | #207 | Poor 11.7% |