Immigrants from Caribbean vs Swiss Disability Age 35 to 64
COMPARE
Immigrants from Caribbean
Swiss
Disability Age 35 to 64
Disability Age 35 to 64 Comparison
Immigrants from Caribbean
Swiss
11.3%
DISABILITY AGE 35 TO 64
41.5/ 100
METRIC RATING
180th/ 347
METRIC RANK
11.6%
DISABILITY AGE 35 TO 64
18.7/ 100
METRIC RATING
200th/ 347
METRIC RANK
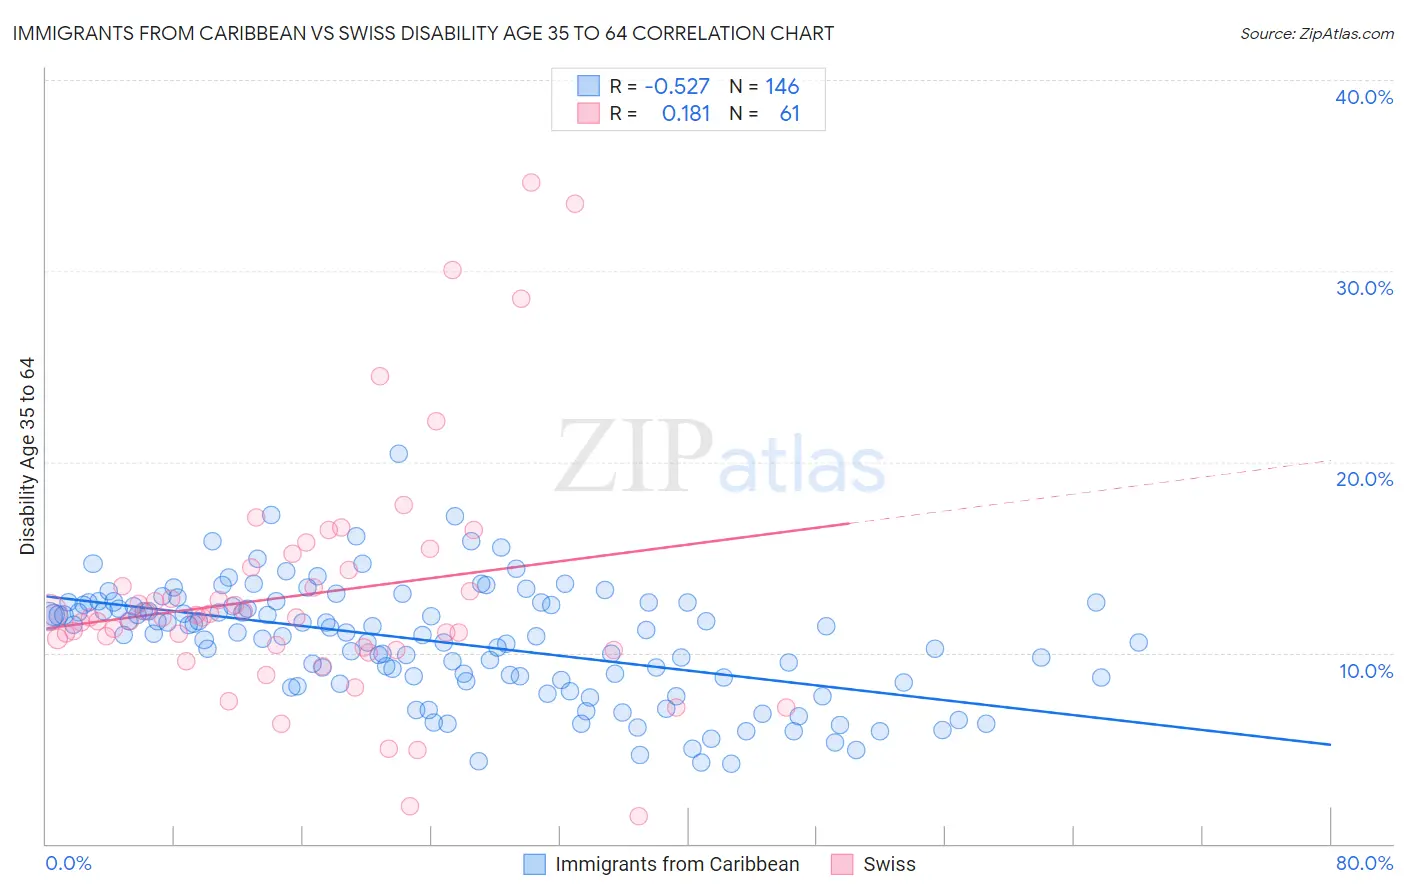
Immigrants from Caribbean vs Swiss Disability Age 35 to 64 Correlation Chart
The statistical analysis conducted on geographies consisting of 449,599,951 people shows a substantial negative correlation between the proportion of Immigrants from Caribbean and percentage of population with a disability between the ages 34 and 64 in the United States with a correlation coefficient (R) of -0.527 and weighted average of 11.3%. Similarly, the statistical analysis conducted on geographies consisting of 464,639,334 people shows a poor positive correlation between the proportion of Swiss and percentage of population with a disability between the ages 34 and 64 in the United States with a correlation coefficient (R) of 0.181 and weighted average of 11.6%, a difference of 2.2%.
Disability Age 35 to 64 Correlation Summary
| Measurement | Immigrants from Caribbean | Swiss |
| Minimum | 4.2% | 1.5% |
| Maximum | 20.4% | 34.6% |
| Range | 16.2% | 33.2% |
| Mean | 10.6% | 13.0% |
| Median | 11.1% | 11.8% |
| Interquartile 25% (IQ1) | 8.6% | 10.2% |
| Interquartile 75% (IQ3) | 12.6% | 14.4% |
| Interquartile Range (IQR) | 4.0% | 4.2% |
| Standard Deviation (Sample) | 3.0% | 6.4% |
| Standard Deviation (Population) | 3.0% | 6.3% |
Demographics Similar to Immigrants from Caribbean and Swiss by Disability Age 35 to 64
In terms of disability age 35 to 64, the demographic groups most similar to Immigrants from Caribbean are Trinidadian and Tobagonian (11.4%, a difference of 0.060%), Icelander (11.4%, a difference of 0.15%), Immigrants from Oceania (11.4%, a difference of 0.17%), Kenyan (11.4%, a difference of 0.19%), and Danish (11.4%, a difference of 0.40%). Similarly, the demographic groups most similar to Swiss are Basque (11.6%, a difference of 0.10%), Immigrants from Panama (11.6%, a difference of 0.21%), Immigrants from Iraq (11.6%, a difference of 0.29%), Iraqi (11.5%, a difference of 0.64%), and Carpatho Rusyn (11.5%, a difference of 0.76%).
| Demographics | Rating | Rank | Disability Age 35 to 64 |
| Immigrants | Caribbean | 41.5 /100 | #180 | Average 11.3% |
| Trinidadians and Tobagonians | 40.8 /100 | #181 | Average 11.4% |
| Icelanders | 39.7 /100 | #182 | Fair 11.4% |
| Immigrants | Oceania | 39.5 /100 | #183 | Fair 11.4% |
| Kenyans | 39.2 /100 | #184 | Fair 11.4% |
| Danes | 36.8 /100 | #185 | Fair 11.4% |
| Slovenes | 36.6 /100 | #186 | Fair 11.4% |
| Immigrants | Bosnia and Herzegovina | 35.2 /100 | #187 | Fair 11.4% |
| Northern Europeans | 34.9 /100 | #188 | Fair 11.4% |
| Hungarians | 34.6 /100 | #189 | Fair 11.4% |
| Immigrants | Nigeria | 32.5 /100 | #190 | Fair 11.4% |
| Swedes | 31.3 /100 | #191 | Fair 11.4% |
| Norwegians | 29.7 /100 | #192 | Fair 11.5% |
| Immigrants | Africa | 29.0 /100 | #193 | Fair 11.5% |
| Immigrants | Latin America | 27.5 /100 | #194 | Fair 11.5% |
| Carpatho Rusyns | 25.3 /100 | #195 | Fair 11.5% |
| Iraqis | 24.2 /100 | #196 | Fair 11.5% |
| Immigrants | Iraq | 21.0 /100 | #197 | Fair 11.6% |
| Immigrants | Panama | 20.4 /100 | #198 | Fair 11.6% |
| Basques | 19.5 /100 | #199 | Poor 11.6% |
| Swiss | 18.7 /100 | #200 | Poor 11.6% |