Yakama vs Immigrants from Lebanon Female Disability
COMPARE
Yakama
Immigrants from Lebanon
Female Disability
Female Disability Comparison
Yakama
Immigrants from Lebanon
13.2%
FEMALE DISABILITY
0.0/ 100
METRIC RATING
292nd/ 347
METRIC RANK
11.5%
FEMALE DISABILITY
99.7/ 100
METRIC RATING
75th/ 347
METRIC RANK
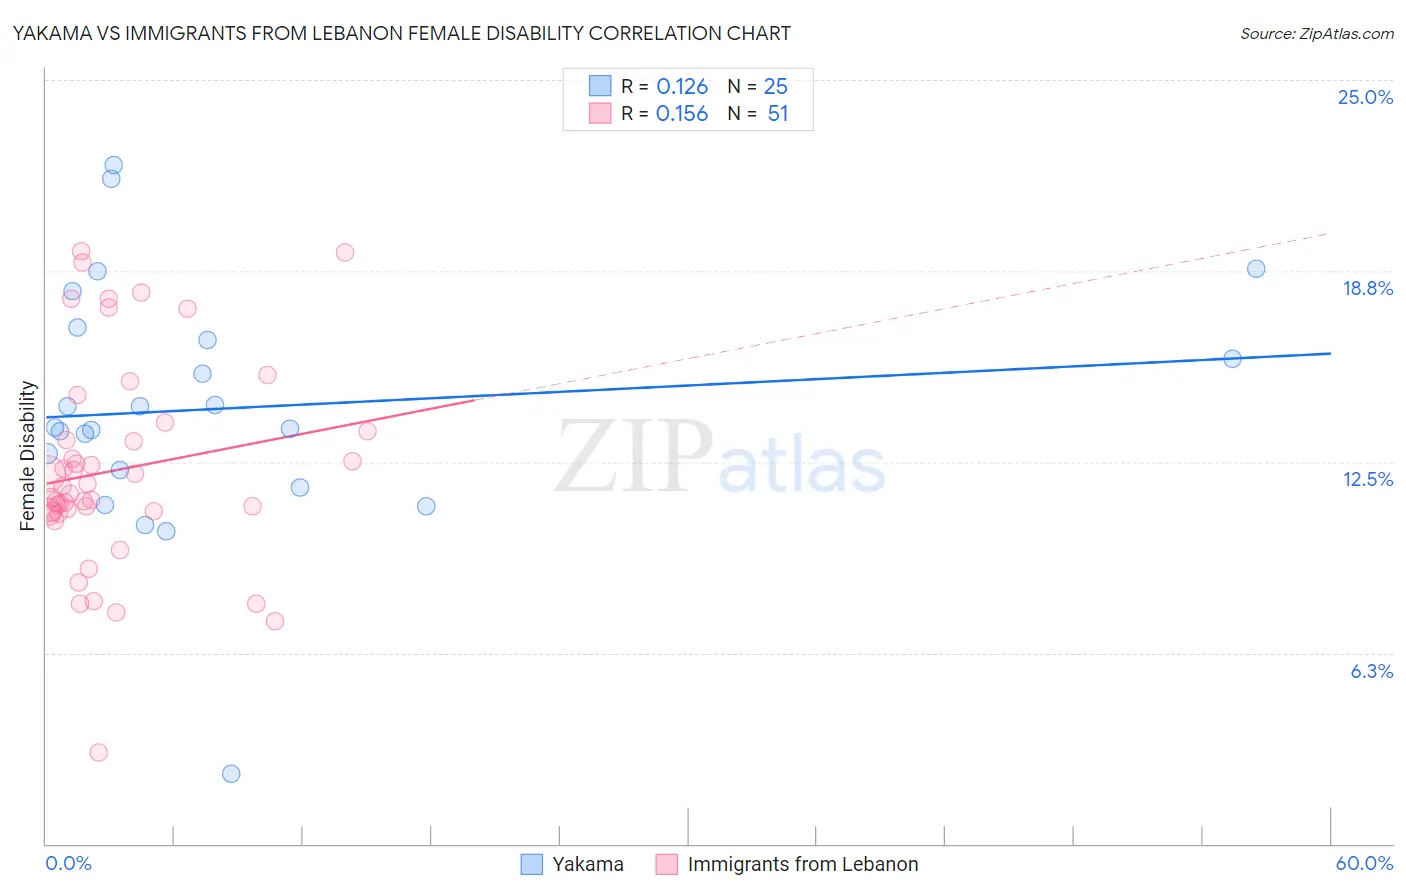
Yakama vs Immigrants from Lebanon Female Disability Correlation Chart
The statistical analysis conducted on geographies consisting of 19,917,587 people shows a poor positive correlation between the proportion of Yakama and percentage of females with a disability in the United States with a correlation coefficient (R) of 0.126 and weighted average of 13.2%. Similarly, the statistical analysis conducted on geographies consisting of 217,152,791 people shows a poor positive correlation between the proportion of Immigrants from Lebanon and percentage of females with a disability in the United States with a correlation coefficient (R) of 0.156 and weighted average of 11.5%, a difference of 15.0%.
Female Disability Correlation Summary
| Measurement | Yakama | Immigrants from Lebanon |
| Minimum | 2.3% | 3.0% |
| Maximum | 22.2% | 19.4% |
| Range | 19.9% | 16.4% |
| Mean | 14.3% | 12.2% |
| Median | 13.6% | 11.5% |
| Interquartile 25% (IQ1) | 12.0% | 10.9% |
| Interquartile 75% (IQ3) | 16.7% | 13.5% |
| Interquartile Range (IQR) | 4.7% | 2.6% |
| Standard Deviation (Sample) | 4.1% | 3.4% |
| Standard Deviation (Population) | 4.0% | 3.4% |
Similar Demographics by Female Disability
Demographics Similar to Yakama by Female Disability
In terms of female disability, the demographic groups most similar to Yakama are Shoshone (13.2%, a difference of 0.17%), Tlingit-Haida (13.2%, a difference of 0.23%), Immigrants from Yemen (13.2%, a difference of 0.23%), Marshallese (13.3%, a difference of 0.26%), and Celtic (13.3%, a difference of 0.31%).
| Demographics | Rating | Rank | Female Disability |
| Bangladeshis | 0.0 /100 | #285 | Tragic 13.1% |
| Fijians | 0.0 /100 | #286 | Tragic 13.1% |
| Yaqui | 0.0 /100 | #287 | Tragic 13.2% |
| Whites/Caucasians | 0.0 /100 | #288 | Tragic 13.2% |
| Tlingit-Haida | 0.0 /100 | #289 | Tragic 13.2% |
| Immigrants | Yemen | 0.0 /100 | #290 | Tragic 13.2% |
| Shoshone | 0.0 /100 | #291 | Tragic 13.2% |
| Yakama | 0.0 /100 | #292 | Tragic 13.2% |
| Marshallese | 0.0 /100 | #293 | Tragic 13.3% |
| Celtics | 0.0 /100 | #294 | Tragic 13.3% |
| French | 0.0 /100 | #295 | Tragic 13.3% |
| Nepalese | 0.0 /100 | #296 | Tragic 13.3% |
| Slovaks | 0.0 /100 | #297 | Tragic 13.3% |
| Immigrants | Nonimmigrants | 0.0 /100 | #298 | Tragic 13.4% |
| Immigrants | Dominican Republic | 0.0 /100 | #299 | Tragic 13.4% |
Demographics Similar to Immigrants from Lebanon by Female Disability
In terms of female disability, the demographic groups most similar to Immigrants from Lebanon are Immigrants from Eritrea (11.5%, a difference of 0.030%), Immigrants from Afghanistan (11.5%, a difference of 0.030%), Immigrants from South Africa (11.5%, a difference of 0.040%), Sierra Leonean (11.5%, a difference of 0.060%), and Immigrants from Jordan (11.5%, a difference of 0.080%).
| Demographics | Rating | Rank | Female Disability |
| Immigrants | Northern Africa | 99.8 /100 | #68 | Exceptional 11.5% |
| Colombians | 99.8 /100 | #69 | Exceptional 11.5% |
| Immigrants | Chile | 99.8 /100 | #70 | Exceptional 11.5% |
| Immigrants | Ireland | 99.8 /100 | #71 | Exceptional 11.5% |
| Chileans | 99.8 /100 | #72 | Exceptional 11.5% |
| Immigrants | Switzerland | 99.8 /100 | #73 | Exceptional 11.5% |
| Bhutanese | 99.8 /100 | #74 | Exceptional 11.5% |
| Immigrants | Lebanon | 99.7 /100 | #75 | Exceptional 11.5% |
| Immigrants | Eritrea | 99.7 /100 | #76 | Exceptional 11.5% |
| Immigrants | Afghanistan | 99.7 /100 | #77 | Exceptional 11.5% |
| Immigrants | South Africa | 99.7 /100 | #78 | Exceptional 11.5% |
| Sierra Leoneans | 99.7 /100 | #79 | Exceptional 11.5% |
| Immigrants | Jordan | 99.7 /100 | #80 | Exceptional 11.5% |
| Eastern Europeans | 99.7 /100 | #81 | Exceptional 11.5% |
| Luxembourgers | 99.6 /100 | #82 | Exceptional 11.6% |