Tongan vs Immigrants from Czechoslovakia Hearing Disability
COMPARE
Tongan
Immigrants from Czechoslovakia
Hearing Disability
Hearing Disability Comparison
Tongans
Immigrants from Czechoslovakia
2.9%
HEARING DISABILITY
78.6/ 100
METRIC RATING
147th/ 347
METRIC RANK
3.1%
HEARING DISABILITY
15.9/ 100
METRIC RATING
204th/ 347
METRIC RANK
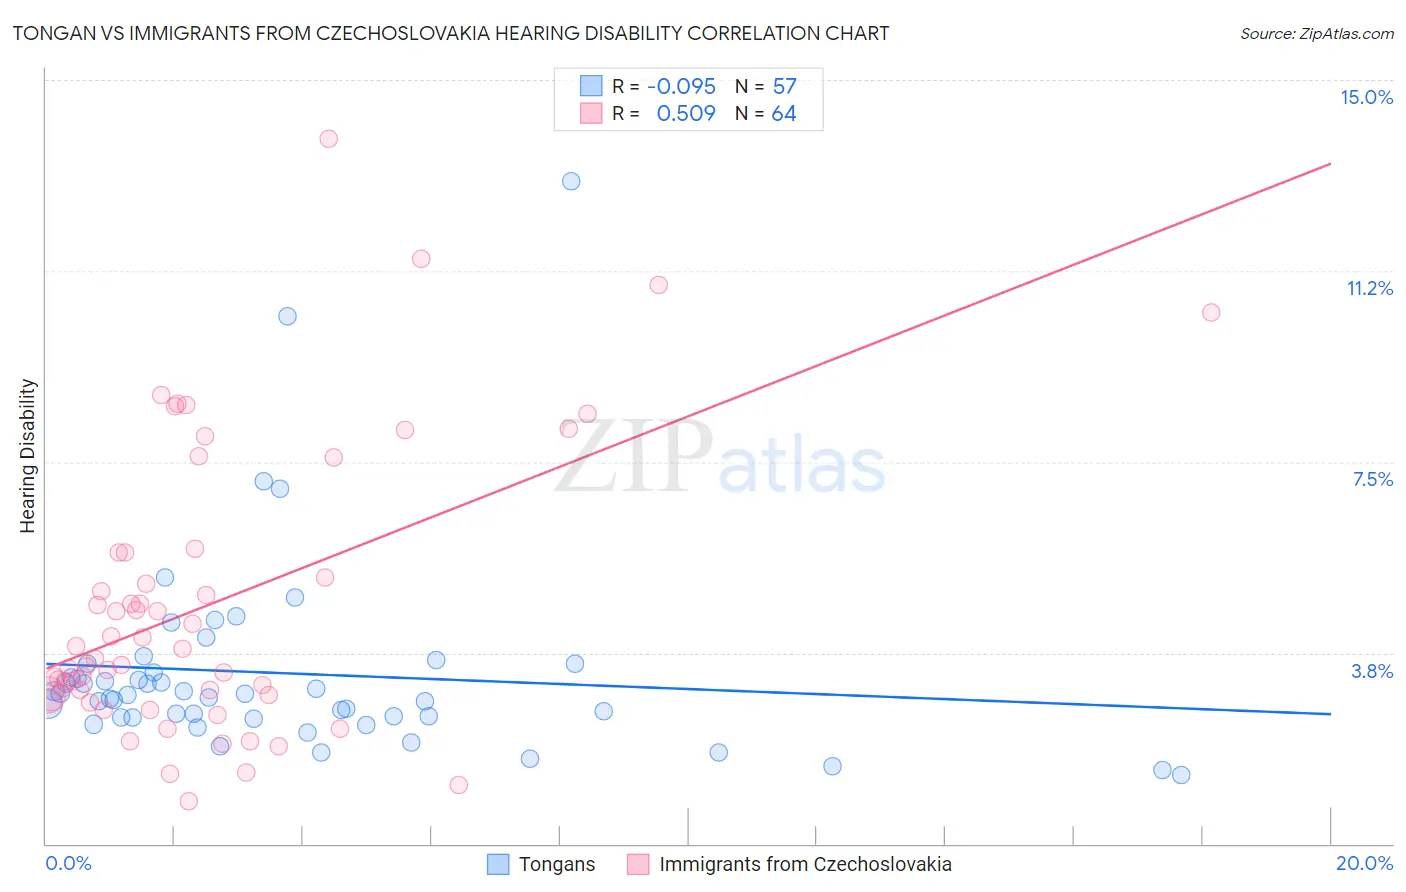
Tongan vs Immigrants from Czechoslovakia Hearing Disability Correlation Chart
The statistical analysis conducted on geographies consisting of 102,876,442 people shows a slight negative correlation between the proportion of Tongans and percentage of population with hearing disability in the United States with a correlation coefficient (R) of -0.095 and weighted average of 2.9%. Similarly, the statistical analysis conducted on geographies consisting of 195,448,522 people shows a substantial positive correlation between the proportion of Immigrants from Czechoslovakia and percentage of population with hearing disability in the United States with a correlation coefficient (R) of 0.509 and weighted average of 3.1%, a difference of 7.2%.
Hearing Disability Correlation Summary
| Measurement | Tongan | Immigrants from Czechoslovakia |
| Minimum | 1.4% | 0.83% |
| Maximum | 13.0% | 13.9% |
| Range | 11.7% | 13.0% |
| Mean | 3.3% | 4.7% |
| Median | 2.9% | 3.7% |
| Interquartile 25% (IQ1) | 2.5% | 2.9% |
| Interquartile 75% (IQ3) | 3.4% | 5.7% |
| Interquartile Range (IQR) | 0.97% | 2.8% |
| Standard Deviation (Sample) | 2.0% | 2.8% |
| Standard Deviation (Population) | 1.9% | 2.8% |
Similar Demographics by Hearing Disability
Demographics Similar to Tongans by Hearing Disability
In terms of hearing disability, the demographic groups most similar to Tongans are Brazilian (2.9%, a difference of 0.010%), Immigrants from Congo (2.9%, a difference of 0.030%), Immigrants from Bulgaria (2.9%, a difference of 0.080%), Immigrants from Russia (2.9%, a difference of 0.13%), and Immigrants from Panama (2.9%, a difference of 0.25%).
| Demographics | Rating | Rank | Hearing Disability |
| Immigrants | Jordan | 83.7 /100 | #140 | Excellent 2.9% |
| Sub-Saharan Africans | 83.3 /100 | #141 | Excellent 2.9% |
| Laotians | 81.1 /100 | #142 | Excellent 2.9% |
| Immigrants | Bahamas | 80.9 /100 | #143 | Excellent 2.9% |
| Immigrants | Bulgaria | 79.2 /100 | #144 | Good 2.9% |
| Immigrants | Congo | 78.9 /100 | #145 | Good 2.9% |
| Brazilians | 78.7 /100 | #146 | Good 2.9% |
| Tongans | 78.6 /100 | #147 | Good 2.9% |
| Immigrants | Russia | 77.7 /100 | #148 | Good 2.9% |
| Immigrants | Panama | 76.9 /100 | #149 | Good 2.9% |
| Palestinians | 73.6 /100 | #150 | Good 2.9% |
| Immigrants | France | 73.1 /100 | #151 | Good 2.9% |
| Immigrants | Lithuania | 73.0 /100 | #152 | Good 2.9% |
| Sudanese | 72.1 /100 | #153 | Good 2.9% |
| Immigrants | Lebanon | 71.5 /100 | #154 | Good 2.9% |
Demographics Similar to Immigrants from Czechoslovakia by Hearing Disability
In terms of hearing disability, the demographic groups most similar to Immigrants from Czechoslovakia are Alsatian (3.1%, a difference of 0.0%), Immigrants from Denmark (3.1%, a difference of 0.050%), Eastern European (3.1%, a difference of 0.070%), Immigrants from Thailand (3.1%, a difference of 0.090%), and Hispanic or Latino (3.1%, a difference of 0.13%).
| Demographics | Rating | Rank | Hearing Disability |
| Immigrants | Bosnia and Herzegovina | 20.6 /100 | #197 | Fair 3.1% |
| Immigrants | Croatia | 20.5 /100 | #198 | Fair 3.1% |
| Syrians | 19.2 /100 | #199 | Poor 3.1% |
| Immigrants | North Macedonia | 19.1 /100 | #200 | Poor 3.1% |
| Iraqis | 19.0 /100 | #201 | Poor 3.1% |
| Immigrants | Thailand | 16.4 /100 | #202 | Poor 3.1% |
| Immigrants | Denmark | 16.2 /100 | #203 | Poor 3.1% |
| Immigrants | Czechoslovakia | 15.9 /100 | #204 | Poor 3.1% |
| Alsatians | 15.9 /100 | #205 | Poor 3.1% |
| Eastern Europeans | 15.5 /100 | #206 | Poor 3.1% |
| Hispanics or Latinos | 15.1 /100 | #207 | Poor 3.1% |
| Immigrants | Latvia | 12.7 /100 | #208 | Poor 3.1% |
| Immigrants | Hungary | 12.5 /100 | #209 | Poor 3.1% |
| Cape Verdeans | 12.2 /100 | #210 | Poor 3.1% |
| Romanians | 12.1 /100 | #211 | Poor 3.1% |