Tlingit-Haida vs Samoan Disability Age 35 to 64
COMPARE
Tlingit-Haida
Samoan
Disability Age 35 to 64
Disability Age 35 to 64 Comparison
Tlingit-Haida
Samoans
13.2%
DISABILITY AGE 35 TO 64
0.0/ 100
METRIC RATING
287th/ 347
METRIC RANK
12.1%
DISABILITY AGE 35 TO 64
2.8/ 100
METRIC RATING
242nd/ 347
METRIC RANK
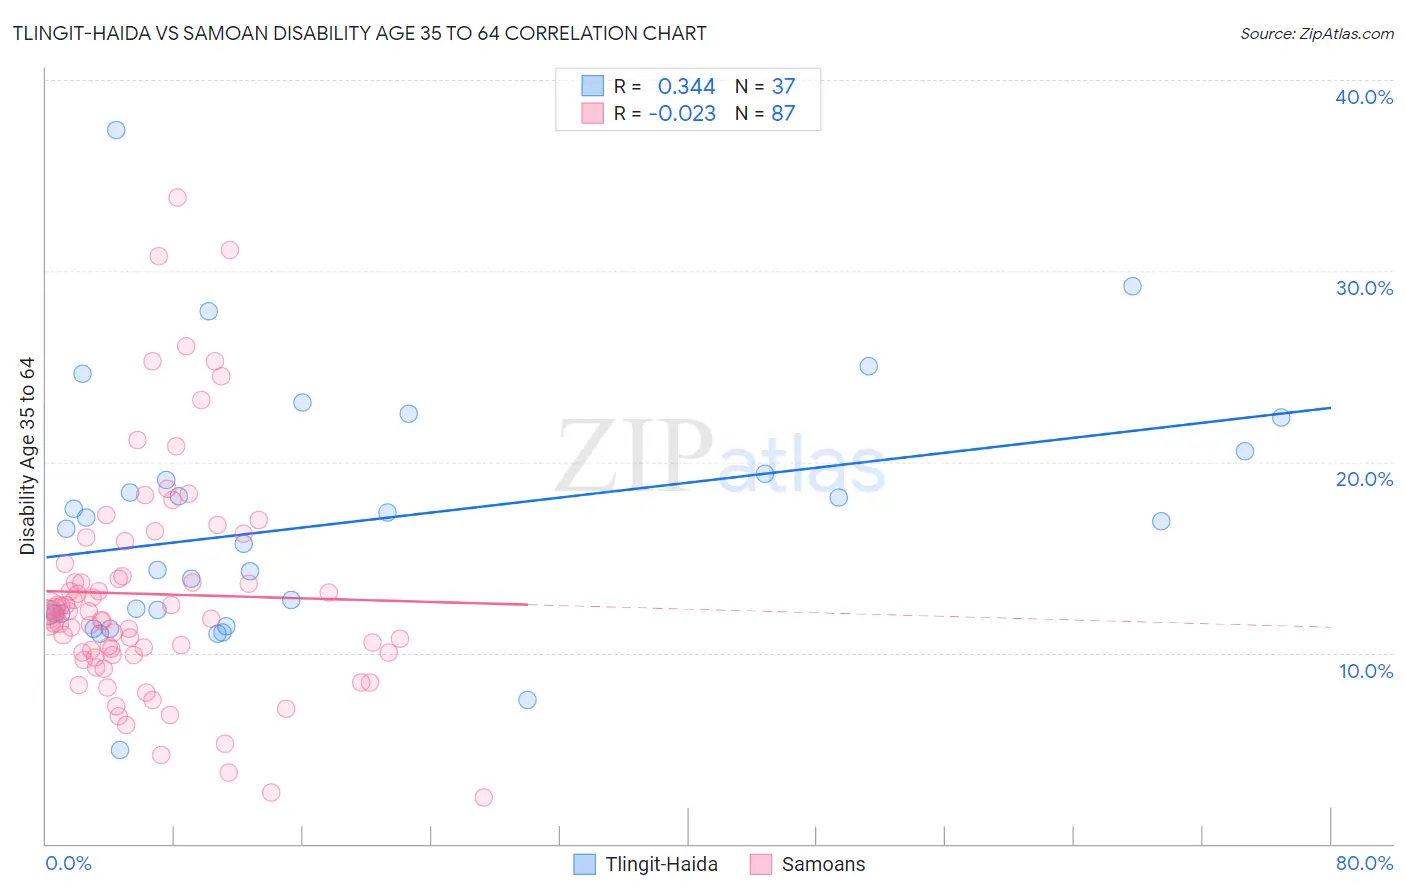
Tlingit-Haida vs Samoan Disability Age 35 to 64 Correlation Chart
The statistical analysis conducted on geographies consisting of 60,853,720 people shows a mild positive correlation between the proportion of Tlingit-Haida and percentage of population with a disability between the ages 34 and 64 in the United States with a correlation coefficient (R) of 0.344 and weighted average of 13.2%. Similarly, the statistical analysis conducted on geographies consisting of 225,063,493 people shows no correlation between the proportion of Samoans and percentage of population with a disability between the ages 34 and 64 in the United States with a correlation coefficient (R) of -0.023 and weighted average of 12.1%, a difference of 9.1%.
Disability Age 35 to 64 Correlation Summary
| Measurement | Tlingit-Haida | Samoan |
| Minimum | 4.9% | 2.4% |
| Maximum | 37.4% | 33.9% |
| Range | 32.4% | 31.4% |
| Mean | 16.8% | 13.1% |
| Median | 16.5% | 12.0% |
| Interquartile 25% (IQ1) | 12.1% | 9.9% |
| Interquartile 75% (IQ3) | 20.0% | 14.6% |
| Interquartile Range (IQR) | 7.9% | 4.7% |
| Standard Deviation (Sample) | 6.5% | 6.0% |
| Standard Deviation (Population) | 6.4% | 5.9% |
Similar Demographics by Disability Age 35 to 64
Demographics Similar to Tlingit-Haida by Disability Age 35 to 64
In terms of disability age 35 to 64, the demographic groups most similar to Tlingit-Haida are Hmong (13.1%, a difference of 0.27%), Fijian (13.2%, a difference of 0.35%), Indonesian (13.2%, a difference of 0.42%), Immigrants from Liberia (13.2%, a difference of 0.50%), and Immigrants from Somalia (13.1%, a difference of 0.58%).
| Demographics | Rating | Rank | Disability Age 35 to 64 |
| Liberians | 0.1 /100 | #280 | Tragic 12.9% |
| Scotch-Irish | 0.1 /100 | #281 | Tragic 13.0% |
| Immigrants | Laos | 0.1 /100 | #282 | Tragic 13.0% |
| Central American Indians | 0.0 /100 | #283 | Tragic 13.0% |
| Immigrants | Nonimmigrants | 0.0 /100 | #284 | Tragic 13.0% |
| Immigrants | Somalia | 0.0 /100 | #285 | Tragic 13.1% |
| Hmong | 0.0 /100 | #286 | Tragic 13.1% |
| Tlingit-Haida | 0.0 /100 | #287 | Tragic 13.2% |
| Fijians | 0.0 /100 | #288 | Tragic 13.2% |
| Indonesians | 0.0 /100 | #289 | Tragic 13.2% |
| Immigrants | Liberia | 0.0 /100 | #290 | Tragic 13.2% |
| Immigrants | Congo | 0.0 /100 | #291 | Tragic 13.3% |
| Puget Sound Salish | 0.0 /100 | #292 | Tragic 13.3% |
| Ute | 0.0 /100 | #293 | Tragic 13.4% |
| Yaqui | 0.0 /100 | #294 | Tragic 13.5% |
Demographics Similar to Samoans by Disability Age 35 to 64
In terms of disability age 35 to 64, the demographic groups most similar to Samoans are Slovak (12.1%, a difference of 0.10%), Mexican American Indian (12.0%, a difference of 0.27%), Immigrants from Western Africa (12.0%, a difference of 0.30%), Immigrants from Thailand (12.0%, a difference of 0.30%), and Finnish (12.1%, a difference of 0.36%).
| Demographics | Rating | Rank | Disability Age 35 to 64 |
| Belizeans | 4.5 /100 | #235 | Tragic 12.0% |
| Immigrants | Middle Africa | 4.5 /100 | #236 | Tragic 12.0% |
| Immigrants | Cambodia | 3.9 /100 | #237 | Tragic 12.0% |
| West Indians | 3.7 /100 | #238 | Tragic 12.0% |
| Immigrants | Western Africa | 3.3 /100 | #239 | Tragic 12.0% |
| Immigrants | Thailand | 3.3 /100 | #240 | Tragic 12.0% |
| Mexican American Indians | 3.2 /100 | #241 | Tragic 12.0% |
| Samoans | 2.8 /100 | #242 | Tragic 12.1% |
| Slovaks | 2.7 /100 | #243 | Tragic 12.1% |
| Finns | 2.3 /100 | #244 | Tragic 12.1% |
| Immigrants | Mexico | 2.2 /100 | #245 | Tragic 12.1% |
| Guamanians/Chamorros | 1.4 /100 | #246 | Tragic 12.2% |
| Immigrants | Senegal | 1.3 /100 | #247 | Tragic 12.2% |
| Spaniards | 1.3 /100 | #248 | Tragic 12.3% |
| Hispanics or Latinos | 1.3 /100 | #249 | Tragic 12.3% |