Tlingit-Haida vs Austrian Disability Age 35 to 64
COMPARE
Tlingit-Haida
Austrian
Disability Age 35 to 64
Disability Age 35 to 64 Comparison
Tlingit-Haida
Austrians
13.2%
DISABILITY AGE 35 TO 64
0.0/ 100
METRIC RATING
287th/ 347
METRIC RANK
11.1%
DISABILITY AGE 35 TO 64
63.2/ 100
METRIC RATING
167th/ 347
METRIC RANK
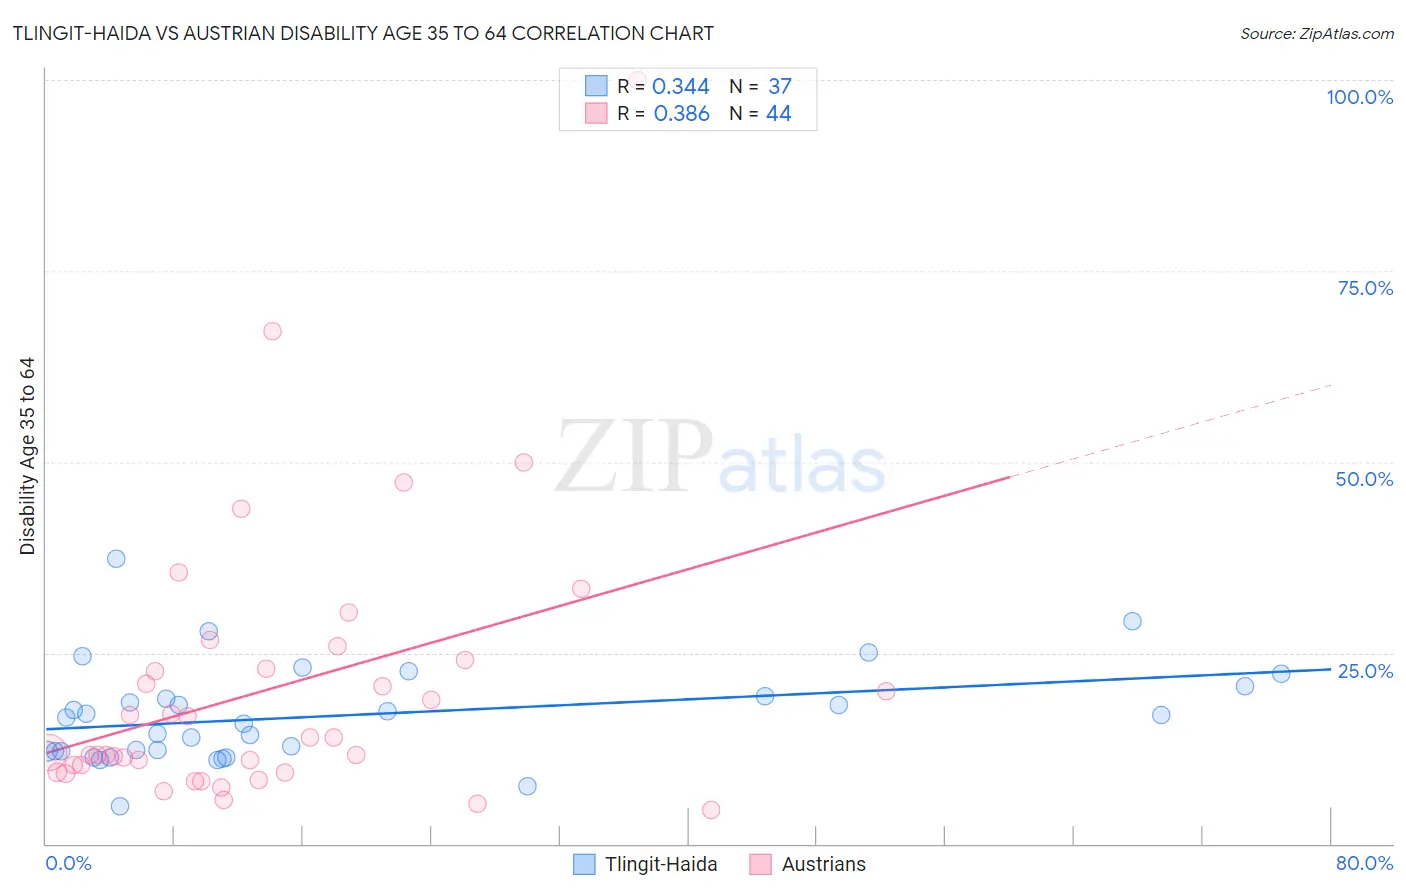
Tlingit-Haida vs Austrian Disability Age 35 to 64 Correlation Chart
The statistical analysis conducted on geographies consisting of 60,853,720 people shows a mild positive correlation between the proportion of Tlingit-Haida and percentage of population with a disability between the ages 34 and 64 in the United States with a correlation coefficient (R) of 0.344 and weighted average of 13.2%. Similarly, the statistical analysis conducted on geographies consisting of 451,701,119 people shows a mild positive correlation between the proportion of Austrians and percentage of population with a disability between the ages 34 and 64 in the United States with a correlation coefficient (R) of 0.386 and weighted average of 11.1%, a difference of 18.2%.
Disability Age 35 to 64 Correlation Summary
| Measurement | Tlingit-Haida | Austrian |
| Minimum | 4.9% | 4.4% |
| Maximum | 37.4% | 100.0% |
| Range | 32.4% | 95.6% |
| Mean | 16.8% | 20.3% |
| Median | 16.5% | 12.9% |
| Interquartile 25% (IQ1) | 12.1% | 9.8% |
| Interquartile 75% (IQ3) | 20.0% | 23.5% |
| Interquartile Range (IQR) | 7.9% | 13.7% |
| Standard Deviation (Sample) | 6.5% | 18.2% |
| Standard Deviation (Population) | 6.4% | 18.0% |
Similar Demographics by Disability Age 35 to 64
Demographics Similar to Tlingit-Haida by Disability Age 35 to 64
In terms of disability age 35 to 64, the demographic groups most similar to Tlingit-Haida are Hmong (13.1%, a difference of 0.27%), Fijian (13.2%, a difference of 0.35%), Indonesian (13.2%, a difference of 0.42%), Immigrants from Liberia (13.2%, a difference of 0.50%), and Immigrants from Somalia (13.1%, a difference of 0.58%).
| Demographics | Rating | Rank | Disability Age 35 to 64 |
| Liberians | 0.1 /100 | #280 | Tragic 12.9% |
| Scotch-Irish | 0.1 /100 | #281 | Tragic 13.0% |
| Immigrants | Laos | 0.1 /100 | #282 | Tragic 13.0% |
| Central American Indians | 0.0 /100 | #283 | Tragic 13.0% |
| Immigrants | Nonimmigrants | 0.0 /100 | #284 | Tragic 13.0% |
| Immigrants | Somalia | 0.0 /100 | #285 | Tragic 13.1% |
| Hmong | 0.0 /100 | #286 | Tragic 13.1% |
| Tlingit-Haida | 0.0 /100 | #287 | Tragic 13.2% |
| Fijians | 0.0 /100 | #288 | Tragic 13.2% |
| Indonesians | 0.0 /100 | #289 | Tragic 13.2% |
| Immigrants | Liberia | 0.0 /100 | #290 | Tragic 13.2% |
| Immigrants | Congo | 0.0 /100 | #291 | Tragic 13.3% |
| Puget Sound Salish | 0.0 /100 | #292 | Tragic 13.3% |
| Ute | 0.0 /100 | #293 | Tragic 13.4% |
| Yaqui | 0.0 /100 | #294 | Tragic 13.5% |
Demographics Similar to Austrians by Disability Age 35 to 64
In terms of disability age 35 to 64, the demographic groups most similar to Austrians are Immigrants from Haiti (11.1%, a difference of 0.050%), Immigrants from Western Europe (11.1%, a difference of 0.17%), Pakistani (11.1%, a difference of 0.23%), Immigrants from St. Vincent and the Grenadines (11.1%, a difference of 0.30%), and Central American (11.2%, a difference of 0.35%).
| Demographics | Rating | Rank | Disability Age 35 to 64 |
| Croatians | 73.1 /100 | #160 | Good 11.0% |
| Immigrants | Guyana | 70.1 /100 | #161 | Good 11.1% |
| Immigrants | Grenada | 68.4 /100 | #162 | Good 11.1% |
| Immigrants | St. Vincent and the Grenadines | 66.6 /100 | #163 | Good 11.1% |
| Pakistanis | 65.8 /100 | #164 | Good 11.1% |
| Immigrants | Western Europe | 65.2 /100 | #165 | Good 11.1% |
| Immigrants | Haiti | 63.8 /100 | #166 | Good 11.1% |
| Austrians | 63.2 /100 | #167 | Good 11.1% |
| Central Americans | 59.1 /100 | #168 | Average 11.2% |
| Haitians | 59.0 /100 | #169 | Average 11.2% |
| Immigrants | Uganda | 58.0 /100 | #170 | Average 11.2% |
| Immigrants | Trinidad and Tobago | 55.9 /100 | #171 | Average 11.2% |
| Italians | 55.6 /100 | #172 | Average 11.2% |
| Lebanese | 51.8 /100 | #173 | Average 11.3% |
| Immigrants | Fiji | 50.0 /100 | #174 | Average 11.3% |