Thai vs French Disability Age 35 to 64
COMPARE
Thai
French
Disability Age 35 to 64
Disability Age 35 to 64 Comparison
Thais
French
8.6%
DISABILITY AGE 35 TO 64
100.0/ 100
METRIC RATING
6th/ 347
METRIC RANK
12.7%
DISABILITY AGE 35 TO 64
0.2/ 100
METRIC RATING
270th/ 347
METRIC RANK
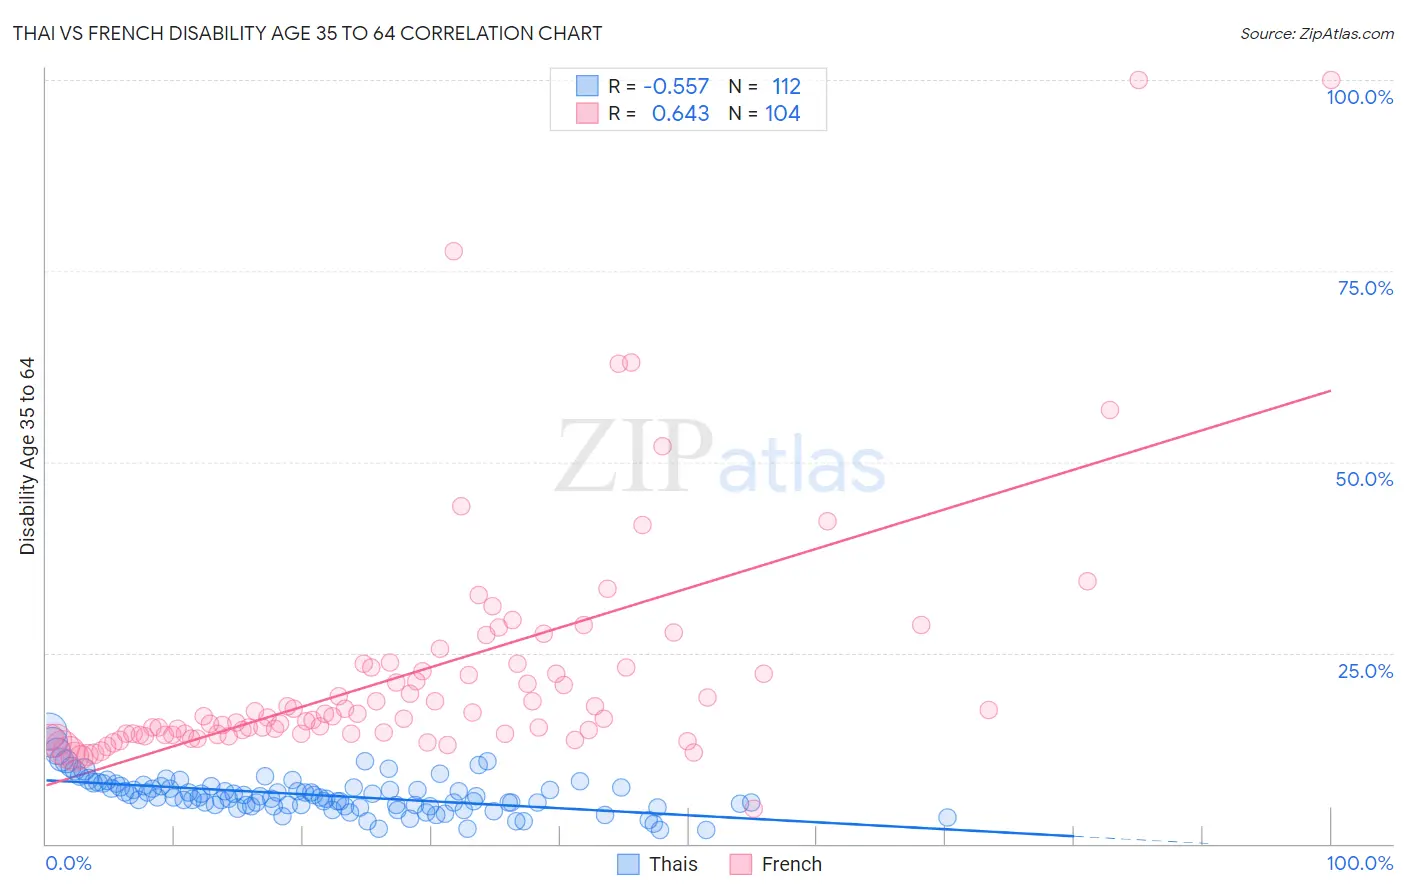
Thai vs French Disability Age 35 to 64 Correlation Chart
The statistical analysis conducted on geographies consisting of 475,261,452 people shows a substantial negative correlation between the proportion of Thais and percentage of population with a disability between the ages 34 and 64 in the United States with a correlation coefficient (R) of -0.557 and weighted average of 8.6%. Similarly, the statistical analysis conducted on geographies consisting of 571,345,081 people shows a significant positive correlation between the proportion of French and percentage of population with a disability between the ages 34 and 64 in the United States with a correlation coefficient (R) of 0.643 and weighted average of 12.7%, a difference of 47.9%.
Disability Age 35 to 64 Correlation Summary
| Measurement | Thai | French |
| Minimum | 1.8% | 4.6% |
| Maximum | 14.7% | 100.0% |
| Range | 12.9% | 95.4% |
| Mean | 6.4% | 22.3% |
| Median | 6.1% | 16.6% |
| Interquartile 25% (IQ1) | 5.0% | 14.3% |
| Interquartile 75% (IQ3) | 7.5% | 23.1% |
| Interquartile Range (IQR) | 2.5% | 8.7% |
| Standard Deviation (Sample) | 2.3% | 16.1% |
| Standard Deviation (Population) | 2.3% | 16.0% |
Similar Demographics by Disability Age 35 to 64
Demographics Similar to Thais by Disability Age 35 to 64
In terms of disability age 35 to 64, the demographic groups most similar to Thais are Immigrants from Israel (8.6%, a difference of 0.42%), Immigrants from Iran (8.5%, a difference of 1.0%), Iranian (8.7%, a difference of 1.0%), Immigrants from China (8.7%, a difference of 1.4%), and Immigrants from Bolivia (8.7%, a difference of 1.7%).
| Demographics | Rating | Rank | Disability Age 35 to 64 |
| Immigrants | Taiwan | 100.0 /100 | #1 | Exceptional 7.8% |
| Filipinos | 100.0 /100 | #2 | Exceptional 8.0% |
| Immigrants | Hong Kong | 100.0 /100 | #3 | Exceptional 8.2% |
| Immigrants | India | 100.0 /100 | #4 | Exceptional 8.3% |
| Immigrants | Iran | 100.0 /100 | #5 | Exceptional 8.5% |
| Thais | 100.0 /100 | #6 | Exceptional 8.6% |
| Immigrants | Israel | 100.0 /100 | #7 | Exceptional 8.6% |
| Iranians | 100.0 /100 | #8 | Exceptional 8.7% |
| Immigrants | China | 100.0 /100 | #9 | Exceptional 8.7% |
| Immigrants | Bolivia | 100.0 /100 | #10 | Exceptional 8.7% |
| Immigrants | Eastern Asia | 100.0 /100 | #11 | Exceptional 8.8% |
| Indians (Asian) | 100.0 /100 | #12 | Exceptional 8.9% |
| Immigrants | South Central Asia | 100.0 /100 | #13 | Exceptional 8.9% |
| Immigrants | Singapore | 100.0 /100 | #14 | Exceptional 8.9% |
| Bolivians | 100.0 /100 | #15 | Exceptional 8.9% |
Demographics Similar to French by Disability Age 35 to 64
In terms of disability age 35 to 64, the demographic groups most similar to French are Spanish (12.7%, a difference of 0.040%), Immigrants from Dominica (12.7%, a difference of 0.14%), Subsaharan African (12.6%, a difference of 0.33%), White/Caucasian (12.6%, a difference of 0.48%), and Nepalese (12.8%, a difference of 1.1%).
| Demographics | Rating | Rank | Disability Age 35 to 64 |
| Immigrants | Zaire | 0.4 /100 | #263 | Tragic 12.5% |
| Immigrants | Portugal | 0.4 /100 | #264 | Tragic 12.5% |
| Marshallese | 0.4 /100 | #265 | Tragic 12.5% |
| Whites/Caucasians | 0.3 /100 | #266 | Tragic 12.6% |
| Sub-Saharan Africans | 0.2 /100 | #267 | Tragic 12.6% |
| Immigrants | Dominica | 0.2 /100 | #268 | Tragic 12.7% |
| Spanish | 0.2 /100 | #269 | Tragic 12.7% |
| French | 0.2 /100 | #270 | Tragic 12.7% |
| Nepalese | 0.1 /100 | #271 | Tragic 12.8% |
| U.S. Virgin Islanders | 0.1 /100 | #272 | Tragic 12.8% |
| Pennsylvania Germans | 0.1 /100 | #273 | Tragic 12.8% |
| Celtics | 0.1 /100 | #274 | Tragic 12.9% |
| Dominicans | 0.1 /100 | #275 | Tragic 12.9% |
| Somalis | 0.1 /100 | #276 | Tragic 12.9% |
| Immigrants | Dominican Republic | 0.1 /100 | #277 | Tragic 12.9% |