Swedish vs Immigrants from Trinidad and Tobago Disability Age 35 to 64
COMPARE
Swedish
Immigrants from Trinidad and Tobago
Disability Age 35 to 64
Disability Age 35 to 64 Comparison
Swedes
Immigrants from Trinidad and Tobago
11.4%
DISABILITY AGE 35 TO 64
31.3/ 100
METRIC RATING
191st/ 347
METRIC RANK
11.2%
DISABILITY AGE 35 TO 64
55.9/ 100
METRIC RATING
171st/ 347
METRIC RANK
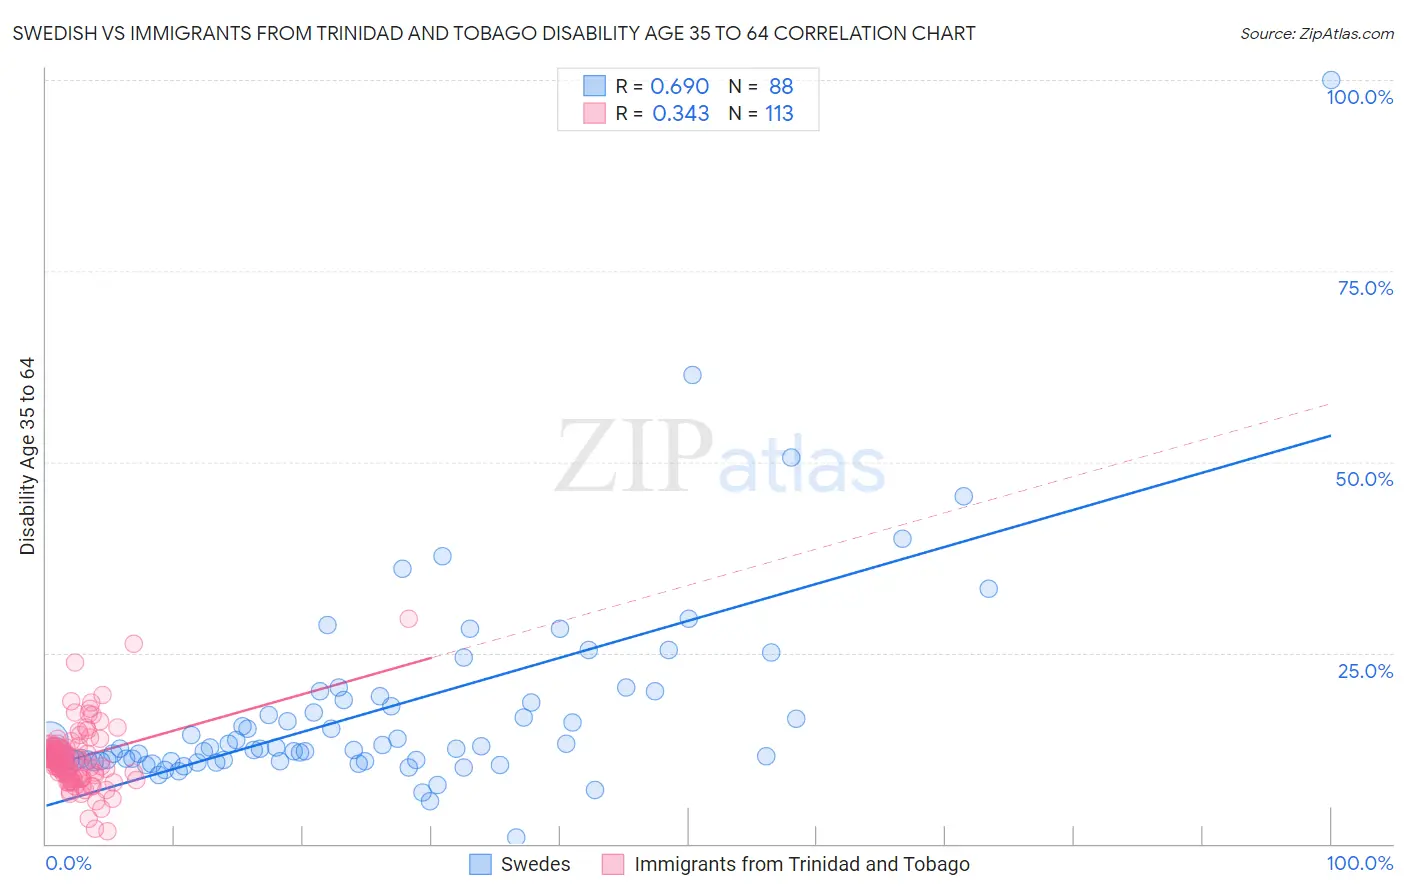
Swedish vs Immigrants from Trinidad and Tobago Disability Age 35 to 64 Correlation Chart
The statistical analysis conducted on geographies consisting of 538,454,121 people shows a significant positive correlation between the proportion of Swedes and percentage of population with a disability between the ages 34 and 64 in the United States with a correlation coefficient (R) of 0.690 and weighted average of 11.4%. Similarly, the statistical analysis conducted on geographies consisting of 223,452,202 people shows a mild positive correlation between the proportion of Immigrants from Trinidad and Tobago and percentage of population with a disability between the ages 34 and 64 in the United States with a correlation coefficient (R) of 0.343 and weighted average of 11.2%, a difference of 2.1%.
Disability Age 35 to 64 Correlation Summary
| Measurement | Swedish | Immigrants from Trinidad and Tobago |
| Minimum | 0.77% | 1.6% |
| Maximum | 100.0% | 29.4% |
| Range | 99.2% | 27.9% |
| Mean | 17.3% | 11.2% |
| Median | 12.5% | 11.0% |
| Interquartile 25% (IQ1) | 10.9% | 8.8% |
| Interquartile 75% (IQ3) | 18.6% | 12.5% |
| Interquartile Range (IQR) | 7.7% | 3.7% |
| Standard Deviation (Sample) | 13.3% | 4.1% |
| Standard Deviation (Population) | 13.3% | 4.0% |
Demographics Similar to Swedes and Immigrants from Trinidad and Tobago by Disability Age 35 to 64
In terms of disability age 35 to 64, the demographic groups most similar to Swedes are Immigrants from Nigeria (11.4%, a difference of 0.11%), Hungarian (11.4%, a difference of 0.30%), Northern European (11.4%, a difference of 0.32%), Immigrants from Bosnia and Herzegovina (11.4%, a difference of 0.34%), and Slovene (11.4%, a difference of 0.47%). Similarly, the demographic groups most similar to Immigrants from Trinidad and Tobago are Italian (11.2%, a difference of 0.020%), Lebanese (11.3%, a difference of 0.34%), Immigrants from Fiji (11.3%, a difference of 0.48%), Czech (11.3%, a difference of 0.65%), and Ugandan (11.3%, a difference of 0.99%).
| Demographics | Rating | Rank | Disability Age 35 to 64 |
| Immigrants | Trinidad and Tobago | 55.9 /100 | #171 | Average 11.2% |
| Italians | 55.6 /100 | #172 | Average 11.2% |
| Lebanese | 51.8 /100 | #173 | Average 11.3% |
| Immigrants | Fiji | 50.0 /100 | #174 | Average 11.3% |
| Czechs | 47.9 /100 | #175 | Average 11.3% |
| Ugandans | 43.7 /100 | #176 | Average 11.3% |
| Immigrants | Eastern Africa | 42.2 /100 | #177 | Average 11.3% |
| Poles | 42.0 /100 | #178 | Average 11.3% |
| Immigrants | Barbados | 41.6 /100 | #179 | Average 11.3% |
| Immigrants | Caribbean | 41.5 /100 | #180 | Average 11.3% |
| Trinidadians and Tobagonians | 40.8 /100 | #181 | Average 11.4% |
| Icelanders | 39.7 /100 | #182 | Fair 11.4% |
| Immigrants | Oceania | 39.5 /100 | #183 | Fair 11.4% |
| Kenyans | 39.2 /100 | #184 | Fair 11.4% |
| Danes | 36.8 /100 | #185 | Fair 11.4% |
| Slovenes | 36.6 /100 | #186 | Fair 11.4% |
| Immigrants | Bosnia and Herzegovina | 35.2 /100 | #187 | Fair 11.4% |
| Northern Europeans | 34.9 /100 | #188 | Fair 11.4% |
| Hungarians | 34.6 /100 | #189 | Fair 11.4% |
| Immigrants | Nigeria | 32.5 /100 | #190 | Fair 11.4% |
| Swedes | 31.3 /100 | #191 | Fair 11.4% |