Delaware vs Immigrants from Trinidad and Tobago Disability Age 35 to 64
COMPARE
Delaware
Immigrants from Trinidad and Tobago
Disability Age 35 to 64
Disability Age 35 to 64 Comparison
Delaware
Immigrants from Trinidad and Tobago
13.7%
DISABILITY AGE 35 TO 64
0.0/ 100
METRIC RATING
300th/ 347
METRIC RANK
11.2%
DISABILITY AGE 35 TO 64
55.9/ 100
METRIC RATING
171st/ 347
METRIC RANK
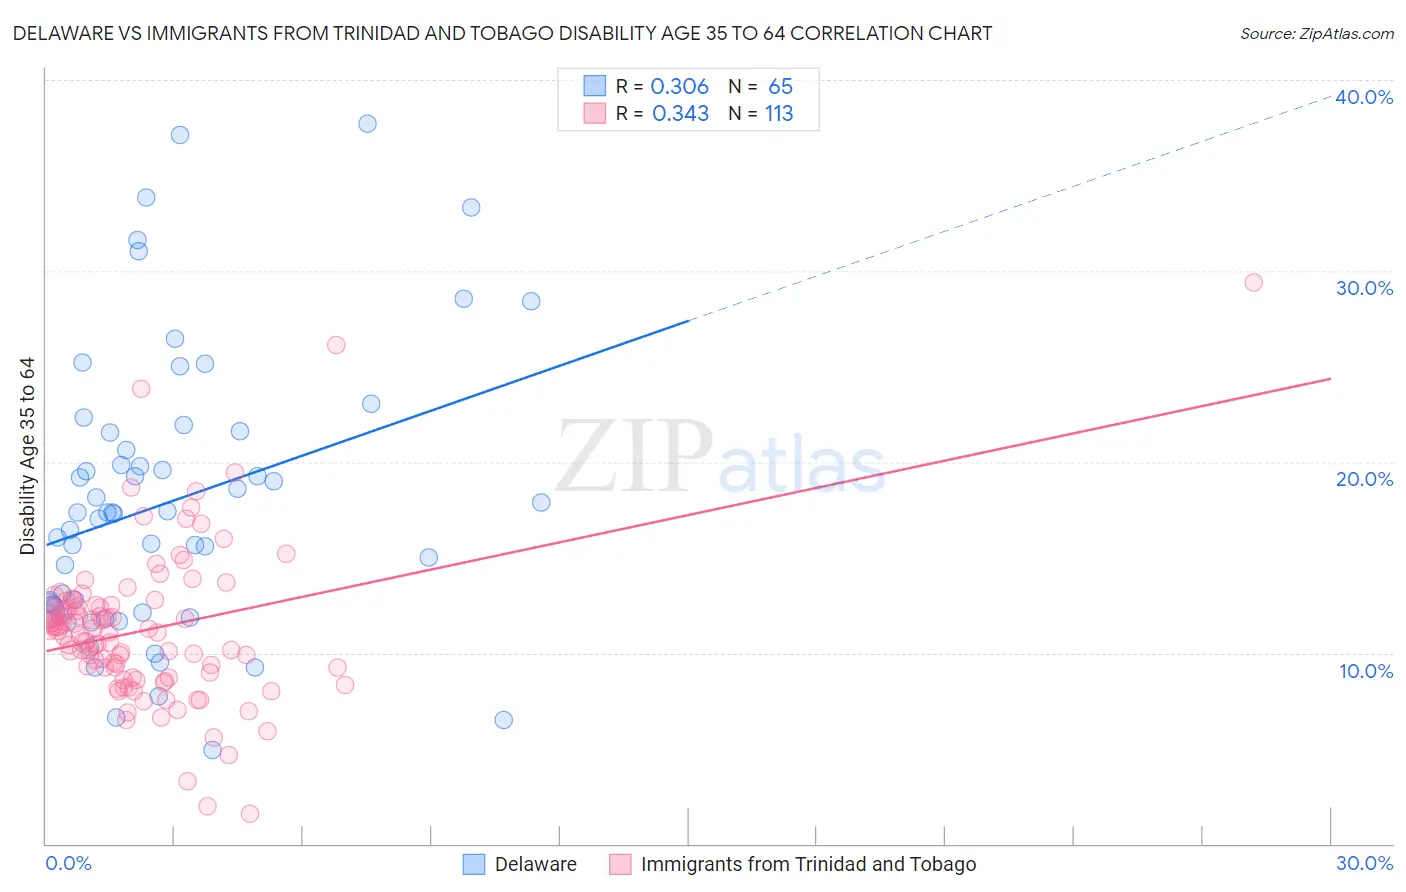
Delaware vs Immigrants from Trinidad and Tobago Disability Age 35 to 64 Correlation Chart
The statistical analysis conducted on geographies consisting of 96,224,166 people shows a mild positive correlation between the proportion of Delaware and percentage of population with a disability between the ages 34 and 64 in the United States with a correlation coefficient (R) of 0.306 and weighted average of 13.7%. Similarly, the statistical analysis conducted on geographies consisting of 223,452,202 people shows a mild positive correlation between the proportion of Immigrants from Trinidad and Tobago and percentage of population with a disability between the ages 34 and 64 in the United States with a correlation coefficient (R) of 0.343 and weighted average of 11.2%, a difference of 21.9%.
Disability Age 35 to 64 Correlation Summary
| Measurement | Delaware | Immigrants from Trinidad and Tobago |
| Minimum | 4.9% | 1.6% |
| Maximum | 37.7% | 29.4% |
| Range | 32.8% | 27.9% |
| Mean | 17.9% | 11.2% |
| Median | 17.3% | 11.0% |
| Interquartile 25% (IQ1) | 12.2% | 8.8% |
| Interquartile 75% (IQ3) | 21.6% | 12.5% |
| Interquartile Range (IQR) | 9.4% | 3.7% |
| Standard Deviation (Sample) | 7.4% | 4.1% |
| Standard Deviation (Population) | 7.4% | 4.0% |
Similar Demographics by Disability Age 35 to 64
Demographics Similar to Delaware by Disability Age 35 to 64
In terms of disability age 35 to 64, the demographic groups most similar to Delaware are Spanish American (13.7%, a difference of 0.080%), Cheyenne (13.6%, a difference of 0.28%), French American Indian (13.7%, a difference of 0.30%), Bangladeshi (13.6%, a difference of 0.31%), and African (13.6%, a difference of 0.66%).
| Demographics | Rating | Rank | Disability Age 35 to 64 |
| Ute | 0.0 /100 | #293 | Tragic 13.4% |
| Yaqui | 0.0 /100 | #294 | Tragic 13.5% |
| Yakama | 0.0 /100 | #295 | Tragic 13.6% |
| Africans | 0.0 /100 | #296 | Tragic 13.6% |
| Bangladeshis | 0.0 /100 | #297 | Tragic 13.6% |
| Cheyenne | 0.0 /100 | #298 | Tragic 13.6% |
| Spanish Americans | 0.0 /100 | #299 | Tragic 13.7% |
| Delaware | 0.0 /100 | #300 | Tragic 13.7% |
| French American Indians | 0.0 /100 | #301 | Tragic 13.7% |
| Aleuts | 0.0 /100 | #302 | Tragic 13.8% |
| Sioux | 0.0 /100 | #303 | Tragic 13.9% |
| Hopi | 0.0 /100 | #304 | Tragic 13.9% |
| Americans | 0.0 /100 | #305 | Tragic 13.9% |
| Immigrants | Yemen | 0.0 /100 | #306 | Tragic 14.0% |
| Blackfeet | 0.0 /100 | #307 | Tragic 14.1% |
Demographics Similar to Immigrants from Trinidad and Tobago by Disability Age 35 to 64
In terms of disability age 35 to 64, the demographic groups most similar to Immigrants from Trinidad and Tobago are Italian (11.2%, a difference of 0.020%), Immigrants from Uganda (11.2%, a difference of 0.17%), Haitian (11.2%, a difference of 0.25%), Central American (11.2%, a difference of 0.26%), and Lebanese (11.3%, a difference of 0.34%).
| Demographics | Rating | Rank | Disability Age 35 to 64 |
| Pakistanis | 65.8 /100 | #164 | Good 11.1% |
| Immigrants | Western Europe | 65.2 /100 | #165 | Good 11.1% |
| Immigrants | Haiti | 63.8 /100 | #166 | Good 11.1% |
| Austrians | 63.2 /100 | #167 | Good 11.1% |
| Central Americans | 59.1 /100 | #168 | Average 11.2% |
| Haitians | 59.0 /100 | #169 | Average 11.2% |
| Immigrants | Uganda | 58.0 /100 | #170 | Average 11.2% |
| Immigrants | Trinidad and Tobago | 55.9 /100 | #171 | Average 11.2% |
| Italians | 55.6 /100 | #172 | Average 11.2% |
| Lebanese | 51.8 /100 | #173 | Average 11.3% |
| Immigrants | Fiji | 50.0 /100 | #174 | Average 11.3% |
| Czechs | 47.9 /100 | #175 | Average 11.3% |
| Ugandans | 43.7 /100 | #176 | Average 11.3% |
| Immigrants | Eastern Africa | 42.2 /100 | #177 | Average 11.3% |
| Poles | 42.0 /100 | #178 | Average 11.3% |