Sri Lankan vs German Female Disability
COMPARE
Sri Lankan
German
Female Disability
Female Disability Comparison
Sri Lankans
Germans
11.4%
FEMALE DISABILITY
99.9/ 100
METRIC RATING
62nd/ 347
METRIC RANK
12.9%
FEMALE DISABILITY
0.1/ 100
METRIC RATING
272nd/ 347
METRIC RANK
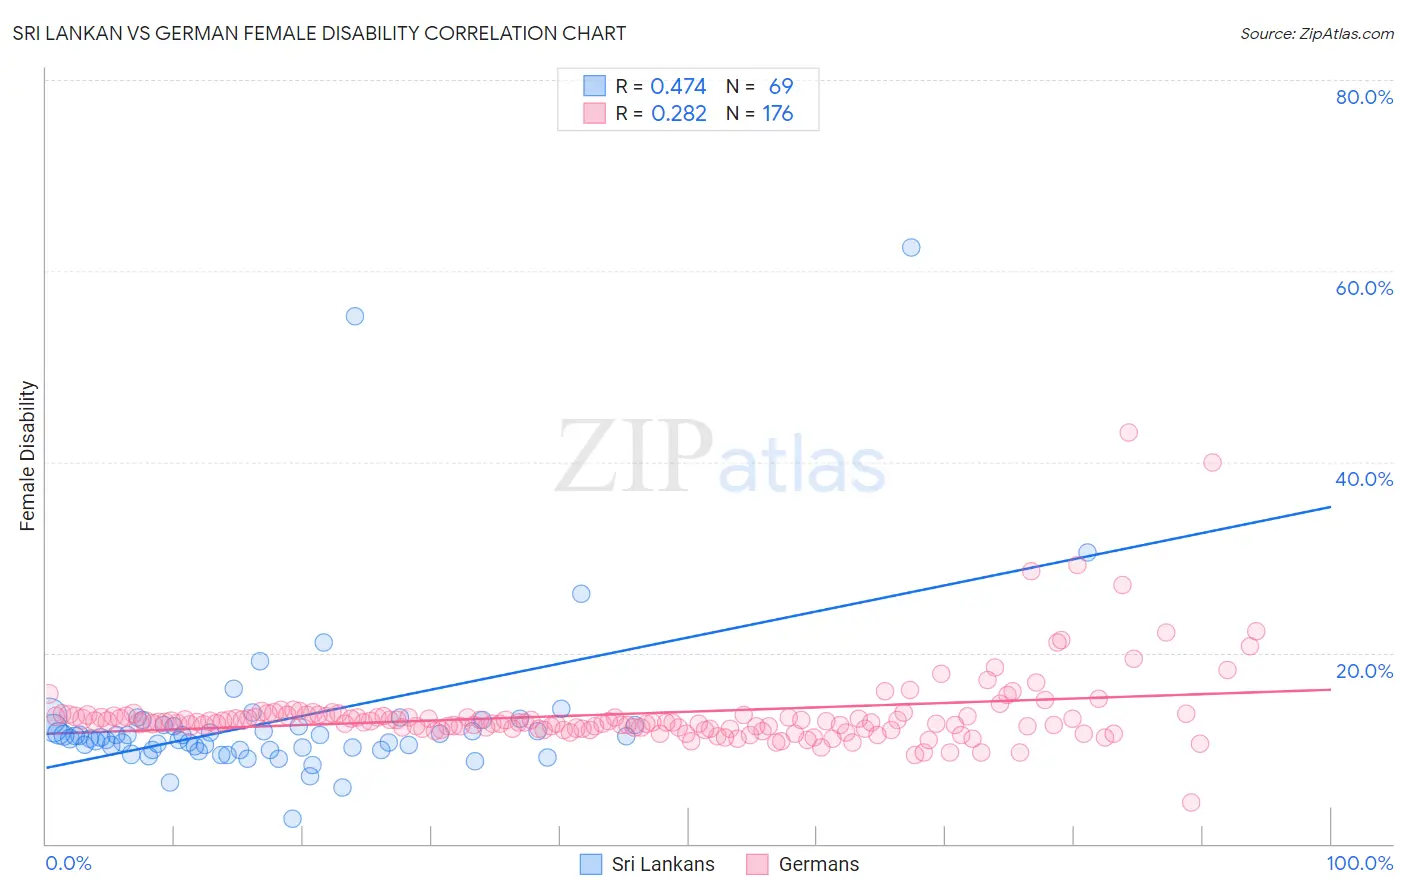
Sri Lankan vs German Female Disability Correlation Chart
The statistical analysis conducted on geographies consisting of 440,479,567 people shows a moderate positive correlation between the proportion of Sri Lankans and percentage of females with a disability in the United States with a correlation coefficient (R) of 0.474 and weighted average of 11.4%. Similarly, the statistical analysis conducted on geographies consisting of 580,718,272 people shows a weak positive correlation between the proportion of Germans and percentage of females with a disability in the United States with a correlation coefficient (R) of 0.282 and weighted average of 12.9%, a difference of 13.4%.
Female Disability Correlation Summary
| Measurement | Sri Lankan | German |
| Minimum | 2.6% | 4.3% |
| Maximum | 62.5% | 43.0% |
| Range | 59.9% | 38.7% |
| Mean | 12.9% | 13.6% |
| Median | 11.2% | 12.7% |
| Interquartile 25% (IQ1) | 9.8% | 12.1% |
| Interquartile 75% (IQ3) | 12.4% | 13.4% |
| Interquartile Range (IQR) | 2.5% | 1.3% |
| Standard Deviation (Sample) | 8.9% | 4.2% |
| Standard Deviation (Population) | 8.9% | 4.2% |
Similar Demographics by Female Disability
Demographics Similar to Sri Lankans by Female Disability
In terms of female disability, the demographic groups most similar to Sri Lankans are Immigrants from France (11.4%, a difference of 0.10%), Immigrants from Colombia (11.4%, a difference of 0.10%), Immigrants from Bulgaria (11.4%, a difference of 0.15%), Immigrants from El Salvador (11.4%, a difference of 0.17%), and Immigrants from South America (11.4%, a difference of 0.19%).
| Demographics | Rating | Rank | Female Disability |
| Bulgarians | 99.9 /100 | #55 | Exceptional 11.3% |
| Taiwanese | 99.9 /100 | #56 | Exceptional 11.4% |
| South Americans | 99.9 /100 | #57 | Exceptional 11.4% |
| Laotians | 99.9 /100 | #58 | Exceptional 11.4% |
| Immigrants | Spain | 99.9 /100 | #59 | Exceptional 11.4% |
| Immigrants | Bulgaria | 99.9 /100 | #60 | Exceptional 11.4% |
| Immigrants | France | 99.9 /100 | #61 | Exceptional 11.4% |
| Sri Lankans | 99.9 /100 | #62 | Exceptional 11.4% |
| Immigrants | Colombia | 99.9 /100 | #63 | Exceptional 11.4% |
| Immigrants | El Salvador | 99.9 /100 | #64 | Exceptional 11.4% |
| Immigrants | South America | 99.9 /100 | #65 | Exceptional 11.4% |
| Salvadorans | 99.8 /100 | #66 | Exceptional 11.5% |
| Immigrants | Vietnam | 99.8 /100 | #67 | Exceptional 11.5% |
| Immigrants | Northern Africa | 99.8 /100 | #68 | Exceptional 11.5% |
| Colombians | 99.8 /100 | #69 | Exceptional 11.5% |
Demographics Similar to Germans by Female Disability
In terms of female disability, the demographic groups most similar to Germans are Sioux (12.9%, a difference of 0.020%), Portuguese (13.0%, a difference of 0.14%), Cheyenne (13.0%, a difference of 0.19%), Dutch (12.9%, a difference of 0.21%), and Immigrants from Dominica (13.0%, a difference of 0.24%).
| Demographics | Rating | Rank | Female Disability |
| West Indians | 0.5 /100 | #265 | Tragic 12.8% |
| Finns | 0.4 /100 | #266 | Tragic 12.8% |
| Senegalese | 0.4 /100 | #267 | Tragic 12.8% |
| Immigrants | Laos | 0.4 /100 | #268 | Tragic 12.8% |
| Indonesians | 0.4 /100 | #269 | Tragic 12.8% |
| Immigrants | Liberia | 0.3 /100 | #270 | Tragic 12.9% |
| Dutch | 0.2 /100 | #271 | Tragic 12.9% |
| Germans | 0.1 /100 | #272 | Tragic 12.9% |
| Sioux | 0.1 /100 | #273 | Tragic 12.9% |
| Portuguese | 0.1 /100 | #274 | Tragic 13.0% |
| Cheyenne | 0.1 /100 | #275 | Tragic 13.0% |
| Immigrants | Dominica | 0.1 /100 | #276 | Tragic 13.0% |
| Spanish | 0.1 /100 | #277 | Tragic 13.0% |
| Scottish | 0.1 /100 | #278 | Tragic 13.0% |
| Arapaho | 0.1 /100 | #279 | Tragic 13.0% |