Spanish American Indian vs Uruguayan Disability Age Over 75
COMPARE
Spanish American Indian
Uruguayan
Disability Age Over 75
Disability Age Over 75 Comparison
Spanish American Indians
Uruguayans
49.9%
DISABILITY AGE OVER 75
0.0/ 100
METRIC RATING
293rd/ 347
METRIC RANK
46.2%
DISABILITY AGE OVER 75
98.4/ 100
METRIC RATING
88th/ 347
METRIC RANK
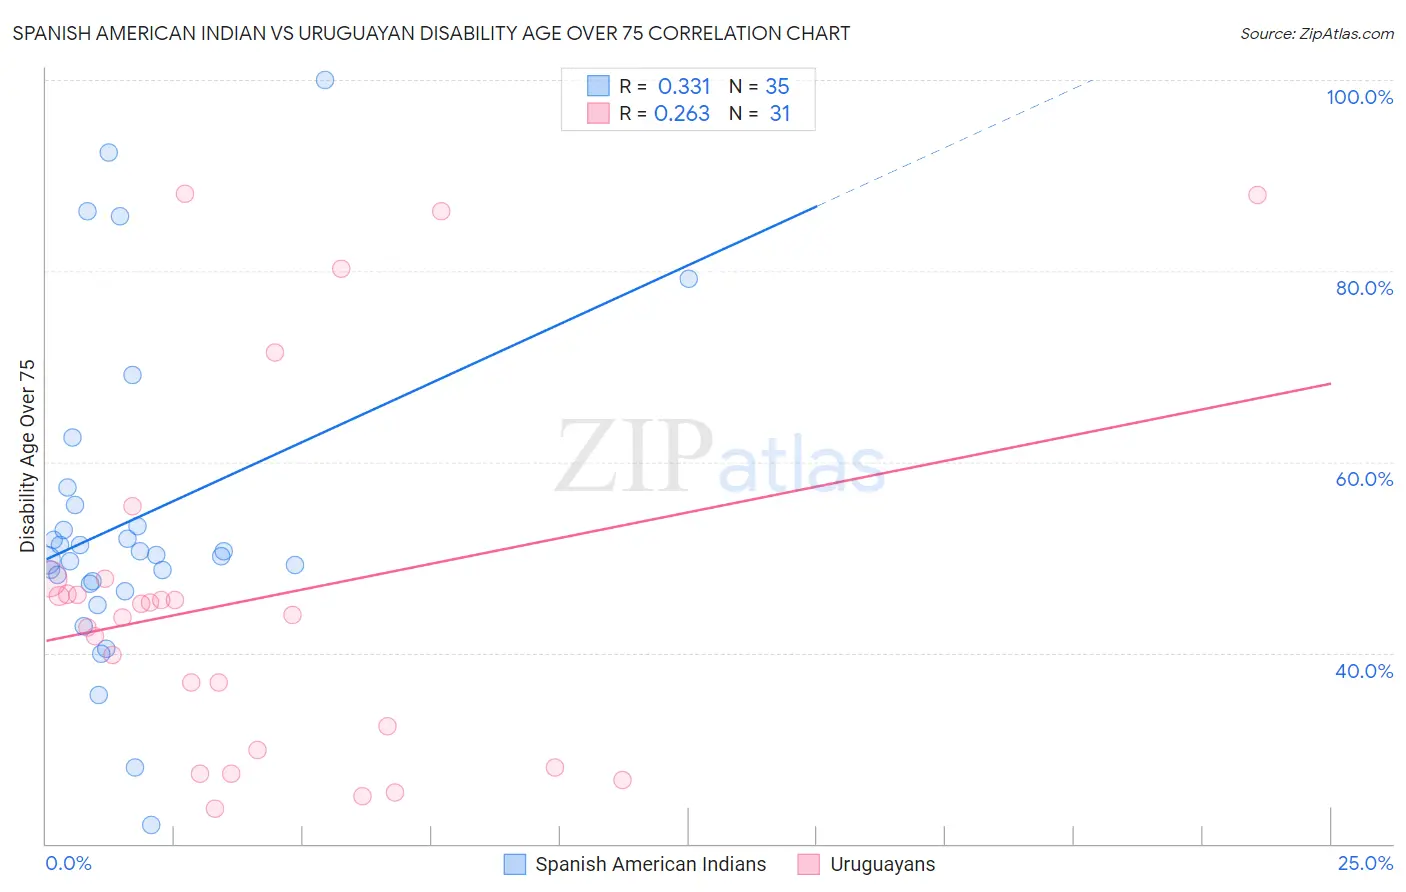
Spanish American Indian vs Uruguayan Disability Age Over 75 Correlation Chart
The statistical analysis conducted on geographies consisting of 73,138,500 people shows a mild positive correlation between the proportion of Spanish American Indians and percentage of population with a disability over the age of 75 in the United States with a correlation coefficient (R) of 0.331 and weighted average of 49.9%. Similarly, the statistical analysis conducted on geographies consisting of 144,749,021 people shows a weak positive correlation between the proportion of Uruguayans and percentage of population with a disability over the age of 75 in the United States with a correlation coefficient (R) of 0.263 and weighted average of 46.2%, a difference of 8.0%.
Disability Age Over 75 Correlation Summary
| Measurement | Spanish American Indian | Uruguayan |
| Minimum | 22.0% | 23.7% |
| Maximum | 100.0% | 88.0% |
| Range | 78.0% | 64.4% |
| Mean | 54.0% | 45.7% |
| Median | 50.2% | 44.0% |
| Interquartile 25% (IQ1) | 47.3% | 29.8% |
| Interquartile 75% (IQ3) | 55.5% | 47.7% |
| Interquartile Range (IQR) | 8.2% | 17.9% |
| Standard Deviation (Sample) | 16.8% | 18.7% |
| Standard Deviation (Population) | 16.6% | 18.4% |
Similar Demographics by Disability Age Over 75
Demographics Similar to Spanish American Indians by Disability Age Over 75
In terms of disability age over 75, the demographic groups most similar to Spanish American Indians are Immigrants from Cambodia (50.0%, a difference of 0.12%), Shoshone (49.9%, a difference of 0.15%), Spanish American (50.0%, a difference of 0.16%), Mexican American Indian (50.0%, a difference of 0.19%), and Arapaho (49.8%, a difference of 0.22%).
| Demographics | Rating | Rank | Disability Age Over 75 |
| Immigrants | Belize | 0.0 /100 | #286 | Tragic 49.6% |
| Sioux | 0.0 /100 | #287 | Tragic 49.7% |
| Yaqui | 0.0 /100 | #288 | Tragic 49.8% |
| Osage | 0.0 /100 | #289 | Tragic 49.8% |
| Puget Sound Salish | 0.0 /100 | #290 | Tragic 49.8% |
| Arapaho | 0.0 /100 | #291 | Tragic 49.8% |
| Shoshone | 0.0 /100 | #292 | Tragic 49.9% |
| Spanish American Indians | 0.0 /100 | #293 | Tragic 49.9% |
| Immigrants | Cambodia | 0.0 /100 | #294 | Tragic 50.0% |
| Spanish Americans | 0.0 /100 | #295 | Tragic 50.0% |
| Mexican American Indians | 0.0 /100 | #296 | Tragic 50.0% |
| Armenians | 0.0 /100 | #297 | Tragic 50.0% |
| Marshallese | 0.0 /100 | #298 | Tragic 50.1% |
| Immigrants | Micronesia | 0.0 /100 | #299 | Tragic 50.1% |
| Cape Verdeans | 0.0 /100 | #300 | Tragic 50.1% |
Demographics Similar to Uruguayans by Disability Age Over 75
In terms of disability age over 75, the demographic groups most similar to Uruguayans are Immigrants from Saudi Arabia (46.3%, a difference of 0.010%), Northern European (46.3%, a difference of 0.020%), Immigrants from Egypt (46.3%, a difference of 0.030%), Danish (46.2%, a difference of 0.080%), and German (46.3%, a difference of 0.080%).
| Demographics | Rating | Rank | Disability Age Over 75 |
| New Zealanders | 98.8 /100 | #81 | Exceptional 46.2% |
| Immigrants | Latvia | 98.7 /100 | #82 | Exceptional 46.2% |
| Argentineans | 98.7 /100 | #83 | Exceptional 46.2% |
| Immigrants | Jordan | 98.7 /100 | #84 | Exceptional 46.2% |
| Immigrants | Southern Europe | 98.6 /100 | #85 | Exceptional 46.2% |
| Romanians | 98.6 /100 | #86 | Exceptional 46.2% |
| Danes | 98.6 /100 | #87 | Exceptional 46.2% |
| Uruguayans | 98.4 /100 | #88 | Exceptional 46.2% |
| Immigrants | Saudi Arabia | 98.4 /100 | #89 | Exceptional 46.3% |
| Northern Europeans | 98.3 /100 | #90 | Exceptional 46.3% |
| Immigrants | Egypt | 98.3 /100 | #91 | Exceptional 46.3% |
| Germans | 98.2 /100 | #92 | Exceptional 46.3% |
| Ugandans | 98.2 /100 | #93 | Exceptional 46.3% |
| Albanians | 98.1 /100 | #94 | Exceptional 46.3% |
| Immigrants | Brazil | 98.0 /100 | #95 | Exceptional 46.3% |