Spanish American Indian vs Maltese Disability Age Over 75
COMPARE
Spanish American Indian
Maltese
Disability Age Over 75
Disability Age Over 75 Comparison
Spanish American Indians
Maltese
49.9%
DISABILITY AGE OVER 75
0.0/ 100
METRIC RATING
293rd/ 347
METRIC RANK
45.8%
DISABILITY AGE OVER 75
99.6/ 100
METRIC RATING
55th/ 347
METRIC RANK
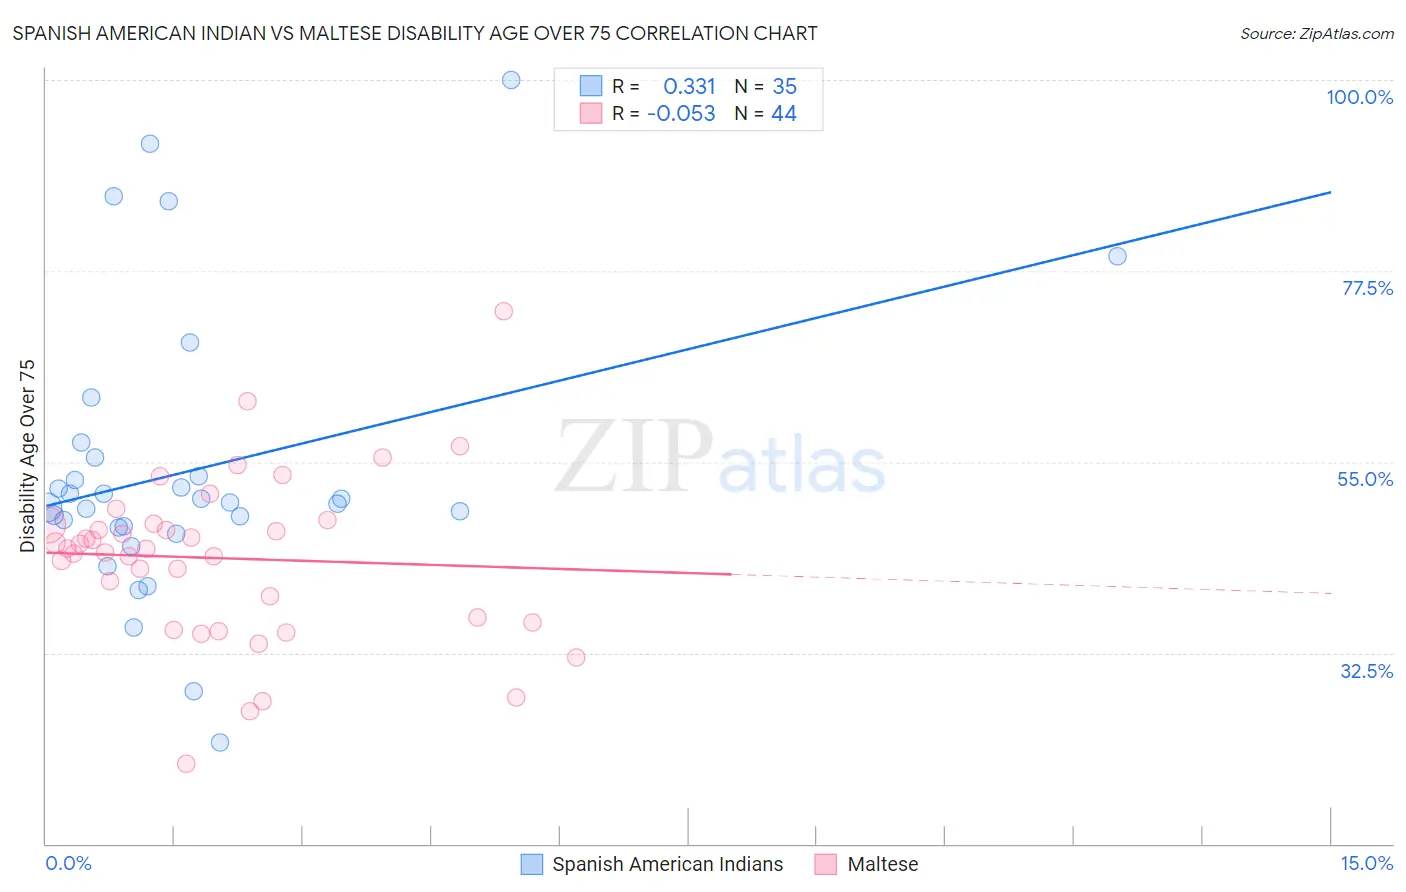
Spanish American Indian vs Maltese Disability Age Over 75 Correlation Chart
The statistical analysis conducted on geographies consisting of 73,138,500 people shows a mild positive correlation between the proportion of Spanish American Indians and percentage of population with a disability over the age of 75 in the United States with a correlation coefficient (R) of 0.331 and weighted average of 49.9%. Similarly, the statistical analysis conducted on geographies consisting of 126,418,061 people shows a slight negative correlation between the proportion of Maltese and percentage of population with a disability over the age of 75 in the United States with a correlation coefficient (R) of -0.053 and weighted average of 45.8%, a difference of 8.9%.
Disability Age Over 75 Correlation Summary
| Measurement | Spanish American Indian | Maltese |
| Minimum | 22.0% | 19.4% |
| Maximum | 100.0% | 72.8% |
| Range | 78.0% | 53.3% |
| Mean | 54.0% | 43.6% |
| Median | 50.2% | 44.8% |
| Interquartile 25% (IQ1) | 47.3% | 36.4% |
| Interquartile 75% (IQ3) | 55.5% | 47.7% |
| Interquartile Range (IQR) | 8.2% | 11.3% |
| Standard Deviation (Sample) | 16.8% | 9.8% |
| Standard Deviation (Population) | 16.6% | 9.7% |
Similar Demographics by Disability Age Over 75
Demographics Similar to Spanish American Indians by Disability Age Over 75
In terms of disability age over 75, the demographic groups most similar to Spanish American Indians are Immigrants from Cambodia (50.0%, a difference of 0.12%), Shoshone (49.9%, a difference of 0.15%), Spanish American (50.0%, a difference of 0.16%), Mexican American Indian (50.0%, a difference of 0.19%), and Arapaho (49.8%, a difference of 0.22%).
| Demographics | Rating | Rank | Disability Age Over 75 |
| Immigrants | Belize | 0.0 /100 | #286 | Tragic 49.6% |
| Sioux | 0.0 /100 | #287 | Tragic 49.7% |
| Yaqui | 0.0 /100 | #288 | Tragic 49.8% |
| Osage | 0.0 /100 | #289 | Tragic 49.8% |
| Puget Sound Salish | 0.0 /100 | #290 | Tragic 49.8% |
| Arapaho | 0.0 /100 | #291 | Tragic 49.8% |
| Shoshone | 0.0 /100 | #292 | Tragic 49.9% |
| Spanish American Indians | 0.0 /100 | #293 | Tragic 49.9% |
| Immigrants | Cambodia | 0.0 /100 | #294 | Tragic 50.0% |
| Spanish Americans | 0.0 /100 | #295 | Tragic 50.0% |
| Mexican American Indians | 0.0 /100 | #296 | Tragic 50.0% |
| Armenians | 0.0 /100 | #297 | Tragic 50.0% |
| Marshallese | 0.0 /100 | #298 | Tragic 50.1% |
| Immigrants | Micronesia | 0.0 /100 | #299 | Tragic 50.1% |
| Cape Verdeans | 0.0 /100 | #300 | Tragic 50.1% |
Demographics Similar to Maltese by Disability Age Over 75
In terms of disability age over 75, the demographic groups most similar to Maltese are Slovak (45.8%, a difference of 0.0%), Immigrants from Netherlands (45.9%, a difference of 0.070%), Immigrants from Italy (45.8%, a difference of 0.080%), Immigrants from Turkey (45.9%, a difference of 0.080%), and Immigrants from Israel (45.9%, a difference of 0.080%).
| Demographics | Rating | Rank | Disability Age Over 75 |
| Croatians | 99.8 /100 | #48 | Exceptional 45.7% |
| Immigrants | North America | 99.8 /100 | #49 | Exceptional 45.7% |
| Belgians | 99.7 /100 | #50 | Exceptional 45.8% |
| Immigrants | Korea | 99.7 /100 | #51 | Exceptional 45.8% |
| Immigrants | France | 99.7 /100 | #52 | Exceptional 45.8% |
| Immigrants | Italy | 99.7 /100 | #53 | Exceptional 45.8% |
| Slovaks | 99.6 /100 | #54 | Exceptional 45.8% |
| Maltese | 99.6 /100 | #55 | Exceptional 45.8% |
| Immigrants | Netherlands | 99.6 /100 | #56 | Exceptional 45.9% |
| Immigrants | Turkey | 99.6 /100 | #57 | Exceptional 45.9% |
| Immigrants | Israel | 99.6 /100 | #58 | Exceptional 45.9% |
| Iranians | 99.6 /100 | #59 | Exceptional 45.9% |
| Immigrants | Europe | 99.6 /100 | #60 | Exceptional 45.9% |
| Immigrants | Argentina | 99.6 /100 | #61 | Exceptional 45.9% |
| Burmese | 99.5 /100 | #62 | Exceptional 45.9% |