Spanish American Indian vs Sierra Leonean Ambulatory Disability
COMPARE
Spanish American Indian
Sierra Leonean
Ambulatory Disability
Ambulatory Disability Comparison
Spanish American Indians
Sierra Leoneans
6.5%
AMBULATORY DISABILITY
0.5/ 100
METRIC RATING
258th/ 347
METRIC RANK
5.7%
AMBULATORY DISABILITY
99.4/ 100
METRIC RATING
70th/ 347
METRIC RANK
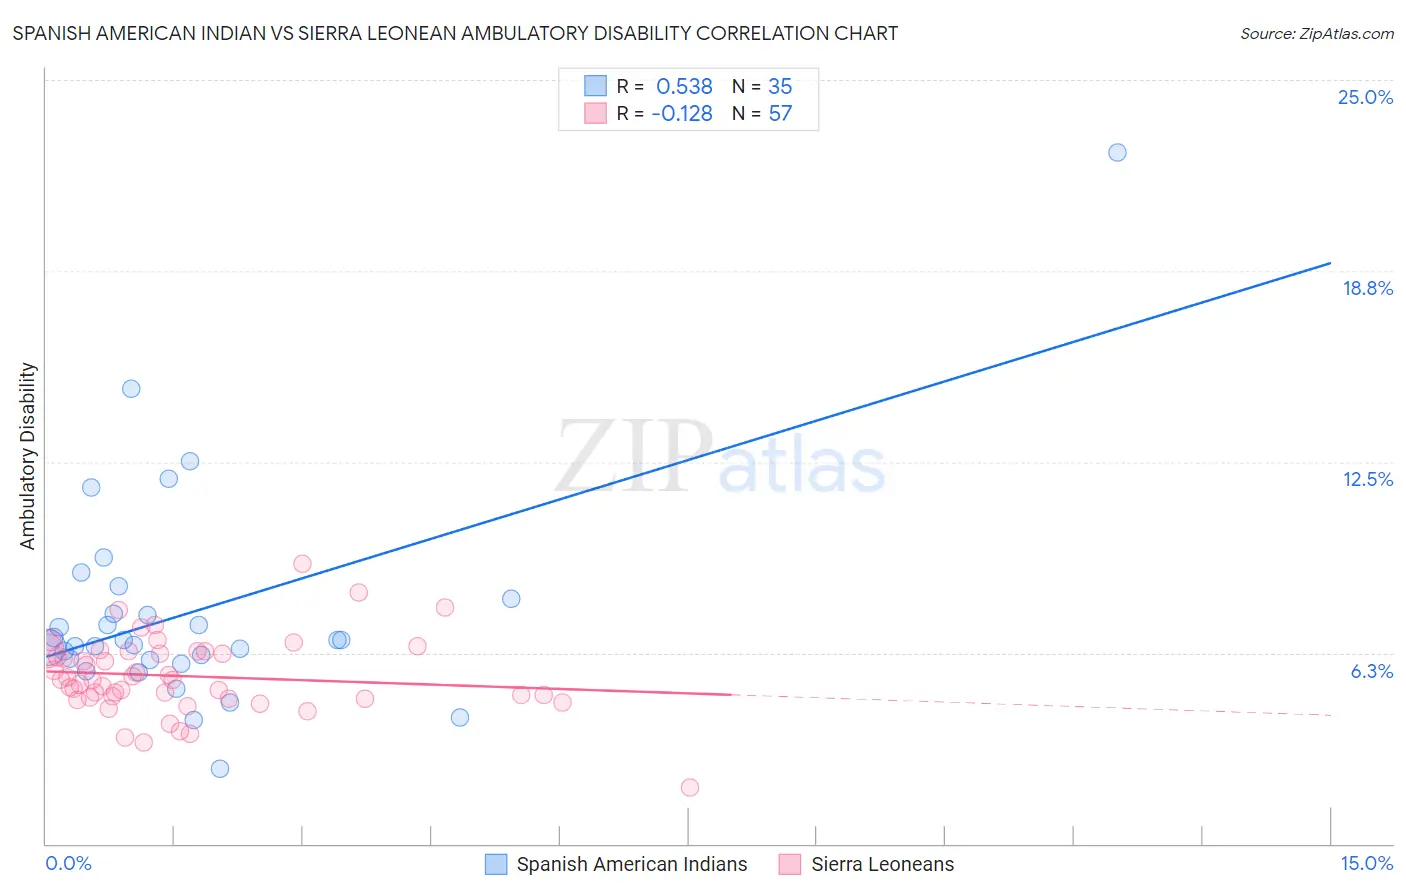
Spanish American Indian vs Sierra Leonean Ambulatory Disability Correlation Chart
The statistical analysis conducted on geographies consisting of 73,149,525 people shows a substantial positive correlation between the proportion of Spanish American Indians and percentage of population with ambulatory disability in the United States with a correlation coefficient (R) of 0.538 and weighted average of 6.5%. Similarly, the statistical analysis conducted on geographies consisting of 83,336,135 people shows a poor negative correlation between the proportion of Sierra Leoneans and percentage of population with ambulatory disability in the United States with a correlation coefficient (R) of -0.128 and weighted average of 5.7%, a difference of 14.8%.
Ambulatory Disability Correlation Summary
| Measurement | Spanish American Indian | Sierra Leonean |
| Minimum | 2.4% | 1.9% |
| Maximum | 22.6% | 9.1% |
| Range | 20.2% | 7.3% |
| Mean | 7.6% | 5.5% |
| Median | 6.7% | 5.4% |
| Interquartile 25% (IQ1) | 6.0% | 4.8% |
| Interquartile 75% (IQ3) | 8.0% | 6.3% |
| Interquartile Range (IQR) | 2.0% | 1.5% |
| Standard Deviation (Sample) | 3.6% | 1.3% |
| Standard Deviation (Population) | 3.5% | 1.2% |
Similar Demographics by Ambulatory Disability
Demographics Similar to Spanish American Indians by Ambulatory Disability
In terms of ambulatory disability, the demographic groups most similar to Spanish American Indians are Bermudan (6.5%, a difference of 0.080%), Immigrants from Uzbekistan (6.5%, a difference of 0.16%), Aleut (6.6%, a difference of 0.18%), Immigrants from Belize (6.6%, a difference of 0.19%), and Welsh (6.5%, a difference of 0.23%).
| Demographics | Rating | Rank | Ambulatory Disability |
| Hawaiians | 0.9 /100 | #251 | Tragic 6.5% |
| Immigrants | Bahamas | 0.8 /100 | #252 | Tragic 6.5% |
| Scottish | 0.7 /100 | #253 | Tragic 6.5% |
| Belizeans | 0.7 /100 | #254 | Tragic 6.5% |
| Welsh | 0.6 /100 | #255 | Tragic 6.5% |
| Immigrants | Uzbekistan | 0.6 /100 | #256 | Tragic 6.5% |
| Bermudans | 0.5 /100 | #257 | Tragic 6.5% |
| Spanish American Indians | 0.5 /100 | #258 | Tragic 6.5% |
| Aleuts | 0.4 /100 | #259 | Tragic 6.6% |
| Immigrants | Belize | 0.4 /100 | #260 | Tragic 6.6% |
| Irish | 0.4 /100 | #261 | Tragic 6.6% |
| English | 0.4 /100 | #262 | Tragic 6.6% |
| Hmong | 0.3 /100 | #263 | Tragic 6.6% |
| Nepalese | 0.2 /100 | #264 | Tragic 6.6% |
| Bahamians | 0.2 /100 | #265 | Tragic 6.6% |
Demographics Similar to Sierra Leoneans by Ambulatory Disability
In terms of ambulatory disability, the demographic groups most similar to Sierra Leoneans are Immigrants from Peru (5.7%, a difference of 0.090%), Brazilian (5.7%, a difference of 0.11%), Immigrants from Northern Africa (5.7%, a difference of 0.12%), Immigrants from Cameroon (5.7%, a difference of 0.13%), and Immigrants from South Africa (5.7%, a difference of 0.18%).
| Demographics | Rating | Rank | Ambulatory Disability |
| Immigrants | France | 99.7 /100 | #63 | Exceptional 5.6% |
| Laotians | 99.7 /100 | #64 | Exceptional 5.7% |
| Immigrants | Switzerland | 99.7 /100 | #65 | Exceptional 5.7% |
| Israelis | 99.6 /100 | #66 | Exceptional 5.7% |
| Immigrants | Uganda | 99.6 /100 | #67 | Exceptional 5.7% |
| Sri Lankans | 99.6 /100 | #68 | Exceptional 5.7% |
| Peruvians | 99.5 /100 | #69 | Exceptional 5.7% |
| Sierra Leoneans | 99.4 /100 | #70 | Exceptional 5.7% |
| Immigrants | Peru | 99.4 /100 | #71 | Exceptional 5.7% |
| Brazilians | 99.4 /100 | #72 | Exceptional 5.7% |
| Immigrants | Northern Africa | 99.4 /100 | #73 | Exceptional 5.7% |
| Immigrants | Cameroon | 99.4 /100 | #74 | Exceptional 5.7% |
| Immigrants | South Africa | 99.3 /100 | #75 | Exceptional 5.7% |
| Sudanese | 99.3 /100 | #76 | Exceptional 5.7% |
| Immigrants | Vietnam | 99.3 /100 | #77 | Exceptional 5.7% |