Spaniard vs Immigrants from Denmark Female Disability

COMPARE

Spaniard
Race
Ancestry
AfghanAfricanAlaska NativeAlaskan AthabascanAlbanianAleutAlsatianAmericanApacheArabArapahoArgentineanArmenianAssyrian/Chaldean/SyriacAustralianAustrianBahamianBangladeshiBarbadianBasqueBelgianBelizeanBermudanBhutaneseBlackfeetBolivianBrazilianBritishBritish West IndianBulgarianBurmeseCajunCambodianCanadianCape VerdeanCarpatho RusynCelticCentral AmericanCentral American IndianCherokeeCheyenneChickasawChileanChineseChippewaChoctawColombianColvilleComancheCosta RicanCreeCreekCroatianCrowCubanCypriotCzechCzechoslovakianDanishDelawareDominicanDutchDutch West IndianEastern EuropeanEcuadorianEgyptianEnglishEstonianEthiopianEuropeanFijianFilipinoFinnishFrenchFrench American IndianFrench CanadianGermanGerman RussianGhanaianGreekGuamanian/ChamorroGuatemalanGuyaneseHaitianHmongHonduranHopiHoumaHungarianIcelanderIndian (Asian)IndonesianInupiatIranianIraqiIrishIroquoisIsraeliItalianJamaicanJapaneseJordanianKenyanKiowaKoreanLaotianLatvianLebaneseLiberianLithuanianLumbeeLuxembourgerMacedonianMalaysianMalteseMarshalleseMenomineeMexicanMexican American IndianMongolianMoroccanNative HawaiianNavajoNepaleseNew ZealanderNicaraguanNigerianNorthern EuropeanNorwegianOkinawanOsageOttawaPaiutePakistaniPalestinianPanamanianParaguayanPennsylvania GermanPeruvianPimaPolishPortuguesePotawatomiPuebloPuerto RicanPuget Sound SalishRomanianRussianSalvadoranSamoanScandinavianScotch-IrishScottishSeminoleSenegaleseSerbianShoshoneSierra LeoneanSiouxSlavicSlovakSloveneSomaliSouth AfricanSouth AmericanSouth American IndianSoviet UnionSpaniardSpanishSpanish AmericanSpanish American IndianSri LankanSubsaharan AfricanSudaneseSwedishSwissSyrianTaiwaneseThaiTlingit-HaidaTohono O'OdhamTonganTrinidadian and TobagonianTsimshianTurkishU.S. Virgin IslanderUgandanUkrainianUruguayanUteVenezuelanVietnameseWelshWest IndianYakamaYaquiYugoslavianYumanYup'ikZimbabwean
Immigration
NonimmigrantsImmigrantsAfghanistanAfricaAlbaniaArgentinaArmeniaAsiaAustraliaAustriaBahamasBangladeshBarbadosBelarusBelgiumBelizeBoliviaBosnia and HerzegovinaBrazilBulgariaBurma/MyanmarCabo VerdeCambodiaCameroonCanadaCaribbeanCentral AmericaChileChinaColombiaCongoCosta RicaCroatiaCubaCzechoslovakiaDominicaDominican RepublicEastern AfricaEastern AsiaEastern EuropeEcuadorEgyptEl SalvadorEnglandEritreaEthiopiaEuropeFijiFranceGermanyGhanaGreeceGrenadaGuatemalaGuyanaHaitiHondurasHong KongHungaryIndiaIndonesiaIranIraqIrelandIsraelItalyJamaicaJapanJordanKazakhstanKenyaKoreaKuwaitLaosLatin AmericaLatviaLebanonLiberiaLithuaniaMalaysiaMexicoMicronesiaMiddle AfricaMoldovaMoroccoNepalNetherlandsNicaraguaNigeriaNorth AmericaNorth MacedoniaNorthern AfricaNorthern EuropeNorwayOceaniaPakistanPanamaPeruPhilippinesPolandPortugalRomaniaRussiaSaudi ArabiaScotlandSenegalSerbiaSierra LeoneSingaporeSomaliaSouth AfricaSouth AmericaSouth Central AsiaSouth Eastern AsiaSouthern EuropeSpainSri LankaSt. Vincent and the GrenadinesSudanSwedenSwitzerlandSyriaTaiwanThailandTrinidad and TobagoTurkeyUgandaUkraineUruguayUzbekistanVenezuelaVietnamWest IndiesWestern AfricaWestern AsiaWestern EuropeYemenZaireZimbabweAzores
Immigrants from Denmark
Race
Ancestry
AfghanAfricanAlaska NativeAlaskan AthabascanAlbanianAleutAlsatianAmericanApacheArabArapahoArgentineanArmenianAssyrian/Chaldean/SyriacAustralianAustrianBahamianBangladeshiBarbadianBasqueBelgianBelizeanBermudanBhutaneseBlackfeetBolivianBrazilianBritishBritish West IndianBulgarianBurmeseCajunCambodianCanadianCape VerdeanCarpatho RusynCelticCentral AmericanCentral American IndianCherokeeCheyenneChickasawChileanChineseChippewaChoctawColombianColvilleComancheCosta RicanCreeCreekCroatianCrowCubanCypriotCzechCzechoslovakianDanishDelawareDominicanDutchDutch West IndianEastern EuropeanEcuadorianEgyptianEnglishEstonianEthiopianEuropeanFijianFilipinoFinnishFrenchFrench American IndianFrench CanadianGermanGerman RussianGhanaianGreekGuamanian/ChamorroGuatemalanGuyaneseHaitianHmongHonduranHopiHoumaHungarianIcelanderIndian (Asian)IndonesianInupiatIranianIraqiIrishIroquoisIsraeliItalianJamaicanJapaneseJordanianKenyanKiowaKoreanLaotianLatvianLebaneseLiberianLithuanianLumbeeLuxembourgerMacedonianMalaysianMalteseMarshalleseMenomineeMexicanMexican American IndianMongolianMoroccanNative HawaiianNavajoNepaleseNew ZealanderNicaraguanNigerianNorthern EuropeanNorwegianOkinawanOsageOttawaPaiutePakistaniPalestinianPanamanianParaguayanPennsylvania GermanPeruvianPimaPolishPortuguesePotawatomiPuebloPuerto RicanPuget Sound SalishRomanianRussianSalvadoranSamoanScandinavianScotch-IrishScottishSeminoleSenegaleseSerbianShoshoneSierra LeoneanSiouxSlavicSlovakSloveneSomaliSouth AfricanSouth AmericanSouth American IndianSoviet UnionSpanishSpanish AmericanSpanish American IndianSri LankanSubsaharan AfricanSudaneseSwedishSwissSyrianTaiwaneseThaiTlingit-HaidaTohono O'OdhamTonganTrinidadian and TobagonianTsimshianTurkishU.S. Virgin IslanderUgandanUkrainianUruguayanUteVenezuelanVietnameseWelshWest IndianYakamaYaquiYugoslavianYumanYup'ikZimbabwean
Immigration
NonimmigrantsImmigrantsAfghanistanAfricaAlbaniaArgentinaArmeniaAsiaAustraliaAustriaBahamasBangladeshBarbadosBelarusBelgiumBelizeBoliviaBosnia and HerzegovinaBrazilBulgariaBurma/MyanmarCabo VerdeCambodiaCameroonCanadaCaribbeanCentral AmericaChileChinaColombiaCongoCosta RicaCroatiaCubaCzechoslovakiaDenmarkDominicaDominican RepublicEastern AfricaEastern AsiaEastern EuropeEcuadorEgyptEl SalvadorEnglandEritreaEthiopiaEuropeFijiFranceGermanyGhanaGreeceGrenadaGuatemalaGuyanaHaitiHondurasHong KongHungaryIndiaIndonesiaIranIraqIrelandIsraelItalyJamaicaJapanJordanKazakhstanKenyaKoreaKuwaitLaosLatin AmericaLatviaLebanonLiberiaLithuaniaMalaysiaMexicoMicronesiaMiddle AfricaMoldovaMoroccoNepalNetherlandsNicaraguaNigeriaNorth AmericaNorth MacedoniaNorthern AfricaNorthern EuropeNorwayOceaniaPakistanPanamaPeruPhilippinesPolandPortugalRomaniaRussiaSaudi ArabiaScotlandSenegalSerbiaSierra LeoneSingaporeSomaliaSouth AfricaSouth AmericaSouth Central AsiaSouth Eastern AsiaSouthern EuropeSpainSri LankaSt. Vincent and the GrenadinesSudanSwedenSwitzerlandSyriaTaiwanThailandTrinidad and TobagoTurkeyUgandaUkraineUruguayUzbekistanVenezuelaVietnamWest IndiesWestern AfricaWestern AsiaWestern EuropeYemenZaireZimbabweAzores
Female Disability
Income
Poverty
Unemployment
Labor Participation
Family Structure
Vehicle Availability
Education Level
Disability

Female Disability Comparison

Spaniards

Immigrants from Denmark

Tragic
Exceptional
12.8%
FEMALE DISABILITY
0.7/ 100
METRIC RATING
263rd/ 347
METRIC RANK
11.6%
FEMALE DISABILITY
99.5/ 100
METRIC RATING
87th/ 347
METRIC RANK

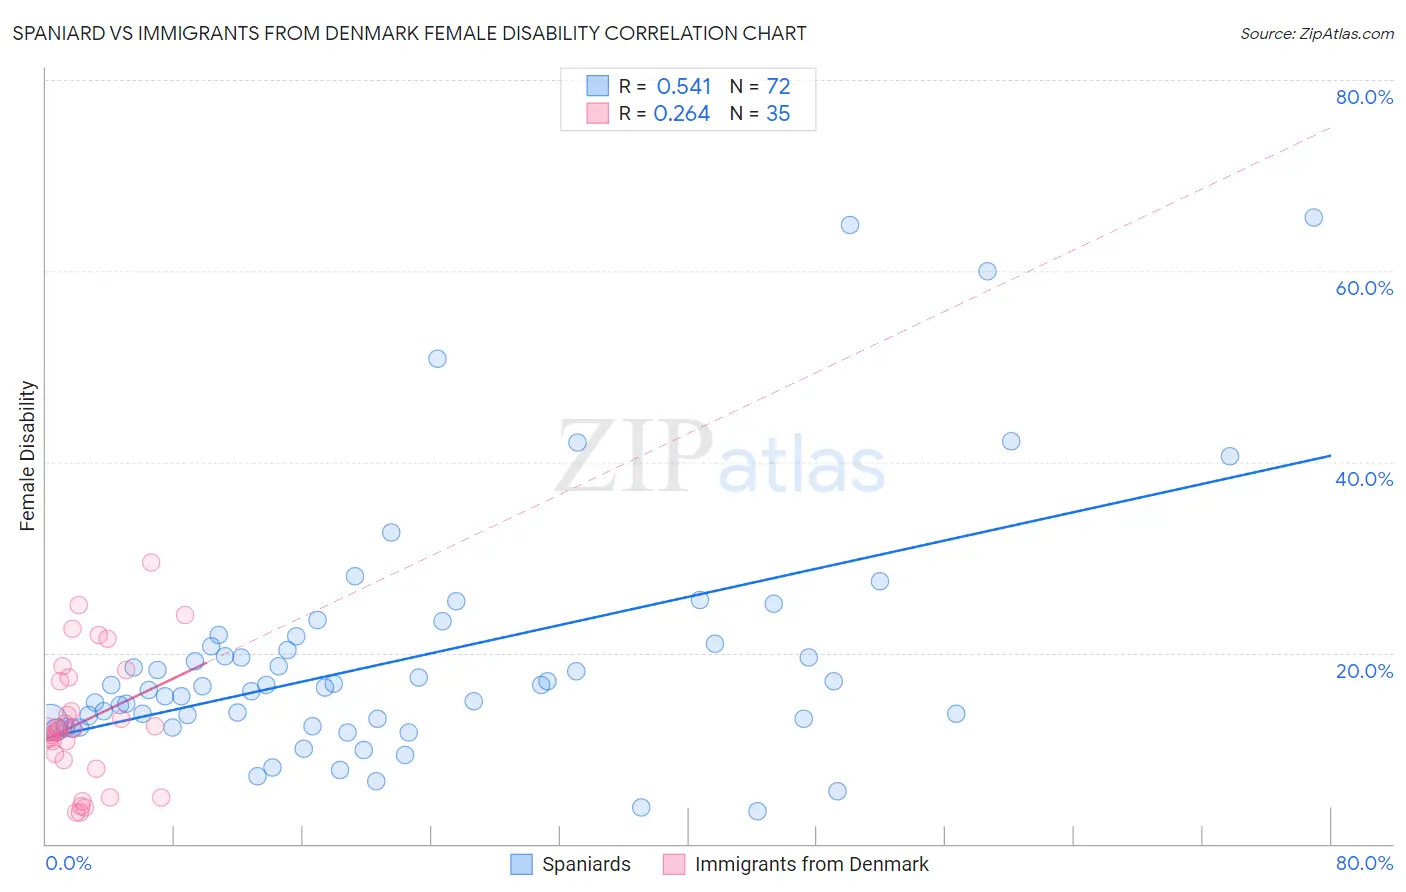
Spaniard vs Immigrants from Denmark Female Disability Correlation Chart

The statistical analysis conducted on geographies consisting of 443,418,073 people shows a substantial positive correlation between the proportion of Spaniards and percentage of females with a disability in the United States with a correlation coefficient (R) of 0.541 and weighted average of 12.8%. Similarly, the statistical analysis conducted on geographies consisting of 136,431,190 people shows a weak positive correlation between the proportion of Immigrants from Denmark and percentage of females with a disability in the United States with a correlation coefficient (R) of 0.264 and weighted average of 11.6%, a difference of 10.2%.
Spaniard vs Immigrants from Denmark Female Disability

Female Disability Correlation Summary

MeasurementSpaniardImmigrants from Denmark
Minimum3.4%3.2%
Maximum65.6%29.5%
Range62.2%26.3%
Mean19.4%12.9%
Median16.4%12.0%
Interquartile 25% (IQ1)12.5%8.7%
Interquartile 75% (IQ3)20.8%17.4%
Interquartile Range (IQR)8.3%8.7%
Standard Deviation (Sample)12.6%6.7%
Standard Deviation (Population)12.5%6.6%

Similar Demographics by Female Disability

Demographics Similar to Spaniards by Female Disability

In terms of female disability, the demographic groups most similar to Spaniards are Alaska Native (12.8%, a difference of 0.12%), Czechoslovakian (12.7%, a difference of 0.23%), Bermudan (12.7%, a difference of 0.30%), West Indian (12.8%, a difference of 0.31%), and Subsaharan African (12.7%, a difference of 0.34%).
DemographicsRating | RankFemale Disability
British West Indians
1.2
/100
|
#256
Tragic
12.7%
Liberians
1.1
/100
|
#257
Tragic
12.7%
Aleuts
1.1
/100
|
#258
Tragic
12.7%
Immigrants | Armenia
1.0
/100
|
#259
Tragic
12.7%
Sub-Saharan Africans
1.0
/100
|
#260
Tragic
12.7%
Bermudans
1.0
/100
|
#261
Tragic
12.7%
Czechoslovakians
0.9
/100
|
#262
Tragic
12.7%
Spaniards
0.7
/100
|
#263
Tragic
12.8%
Alaska Natives
0.6
/100
|
#264
Tragic
12.8%
West Indians
0.5
/100
|
#265
Tragic
12.8%
Finns
0.4
/100
|
#266
Tragic
12.8%
Senegalese
0.4
/100
|
#267
Tragic
12.8%
Immigrants | Laos
0.4
/100
|
#268
Tragic
12.8%
Indonesians
0.4
/100
|
#269
Tragic
12.8%
Immigrants | Liberia
0.3
/100
|
#270
Tragic
12.9%

Demographics Similar to Immigrants from Denmark by Female Disability

In terms of female disability, the demographic groups most similar to Immigrants from Denmark are Yup'ik (11.6%, a difference of 0.0%), Palestinian (11.6%, a difference of 0.070%), Immigrants from Cameroon (11.6%, a difference of 0.070%), Immigrants from Poland (11.6%, a difference of 0.10%), and Vietnamese (11.6%, a difference of 0.10%).
DemographicsRating | RankFemale Disability
Immigrants | Jordan
99.7
/100
|
#80
Exceptional
11.5%
Eastern Europeans
99.7
/100
|
#81
Exceptional
11.5%
Luxembourgers
99.6
/100
|
#82
Exceptional
11.6%
Immigrants | Serbia
99.6
/100
|
#83
Exceptional
11.6%
Immigrants | Poland
99.6
/100
|
#84
Exceptional
11.6%
Palestinians
99.6
/100
|
#85
Exceptional
11.6%
Immigrants | Cameroon
99.6
/100
|
#86
Exceptional
11.6%
Immigrants | Denmark
99.5
/100
|
#87
Exceptional
11.6%
Yup'ik
99.5
/100
|
#88
Exceptional
11.6%
Vietnamese
99.5
/100
|
#89
Exceptional
11.6%
Immigrants | Romania
99.5
/100
|
#90
Exceptional
11.6%
Immigrants | Zimbabwe
99.5
/100
|
#91
Exceptional
11.6%
Immigrants | Czechoslovakia
99.5
/100
|
#92
Exceptional
11.6%
Immigrants | Sierra Leone
99.4
/100
|
#93
Exceptional
11.6%
Immigrants | Brazil
99.4
/100
|
#94
Exceptional
11.6%