Soviet Union vs Chickasaw Ambulatory Disability
COMPARE
Soviet Union
Chickasaw
Ambulatory Disability
Ambulatory Disability Comparison
Soviet Union
Chickasaw
5.8%
AMBULATORY DISABILITY
98.9/ 100
METRIC RATING
88th/ 347
METRIC RANK
8.0%
AMBULATORY DISABILITY
0.0/ 100
METRIC RATING
335th/ 347
METRIC RANK
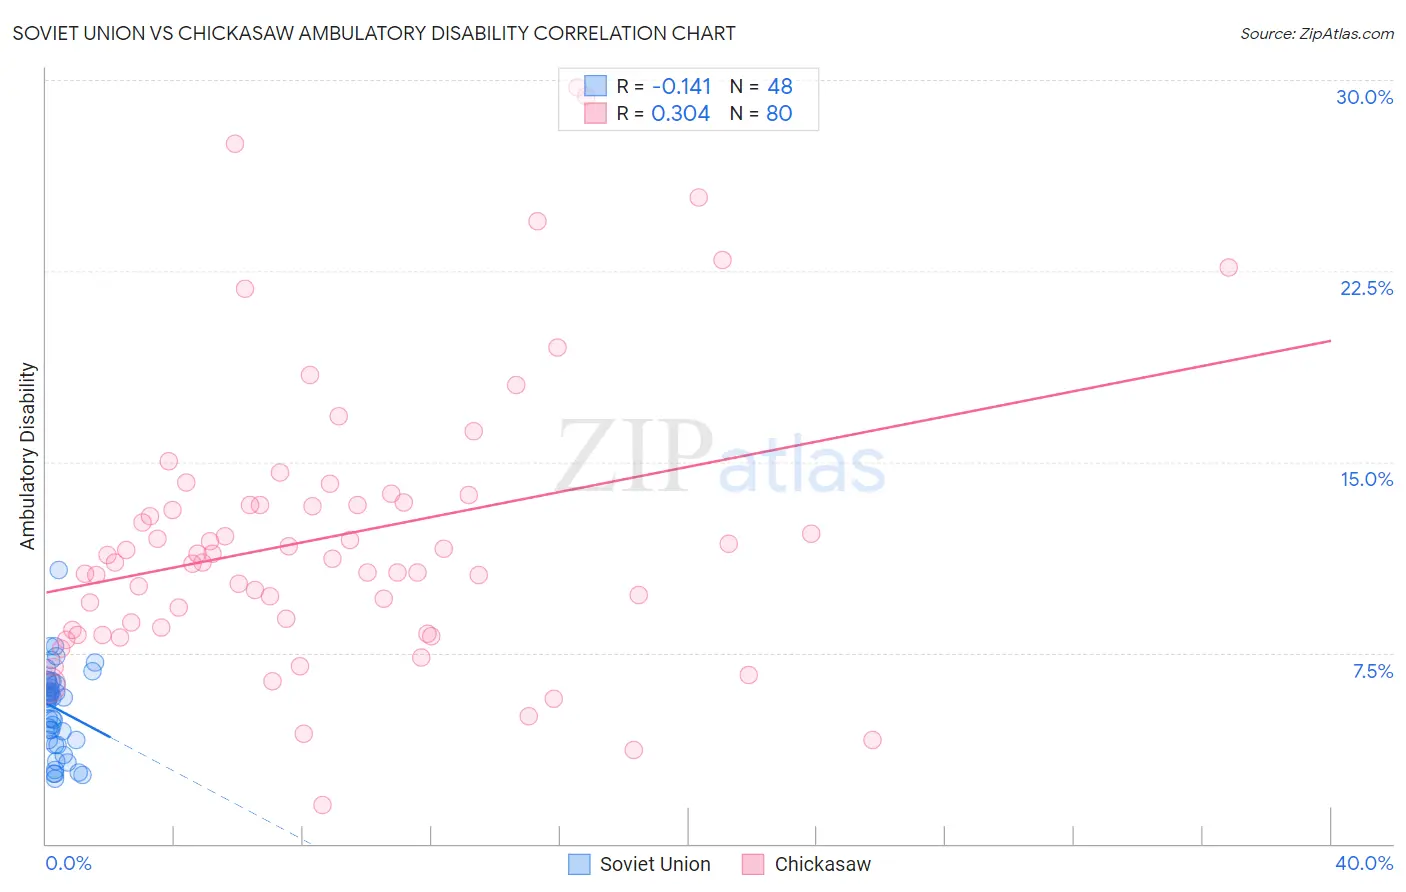
Soviet Union vs Chickasaw Ambulatory Disability Correlation Chart
The statistical analysis conducted on geographies consisting of 43,487,843 people shows a poor negative correlation between the proportion of Soviet Union and percentage of population with ambulatory disability in the United States with a correlation coefficient (R) of -0.141 and weighted average of 5.8%. Similarly, the statistical analysis conducted on geographies consisting of 147,679,473 people shows a mild positive correlation between the proportion of Chickasaw and percentage of population with ambulatory disability in the United States with a correlation coefficient (R) of 0.304 and weighted average of 8.0%, a difference of 39.6%.
Ambulatory Disability Correlation Summary
| Measurement | Soviet Union | Chickasaw |
| Minimum | 2.6% | 1.5% |
| Maximum | 10.8% | 29.7% |
| Range | 8.2% | 28.2% |
| Mean | 5.3% | 12.1% |
| Median | 5.7% | 11.1% |
| Interquartile 25% (IQ1) | 4.1% | 8.4% |
| Interquartile 75% (IQ3) | 6.3% | 13.4% |
| Interquartile Range (IQR) | 2.3% | 4.9% |
| Standard Deviation (Sample) | 1.7% | 5.6% |
| Standard Deviation (Population) | 1.6% | 5.6% |
Similar Demographics by Ambulatory Disability
Demographics Similar to Soviet Union by Ambulatory Disability
In terms of ambulatory disability, the demographic groups most similar to Soviet Union are Immigrants from Chile (5.8%, a difference of 0.040%), Latvian (5.7%, a difference of 0.11%), Bhutanese (5.8%, a difference of 0.12%), Australian (5.8%, a difference of 0.12%), and Immigrants from Sudan (5.8%, a difference of 0.12%).
| Demographics | Rating | Rank | Ambulatory Disability |
| Immigrants | Jordan | 99.2 /100 | #81 | Exceptional 5.7% |
| Palestinians | 99.2 /100 | #82 | Exceptional 5.7% |
| Eastern Europeans | 99.2 /100 | #83 | Exceptional 5.7% |
| Ugandans | 99.2 /100 | #84 | Exceptional 5.7% |
| South Americans | 99.0 /100 | #85 | Exceptional 5.7% |
| Latvians | 99.0 /100 | #86 | Exceptional 5.7% |
| Immigrants | Chile | 98.9 /100 | #87 | Exceptional 5.8% |
| Soviet Union | 98.9 /100 | #88 | Exceptional 5.8% |
| Bhutanese | 98.8 /100 | #89 | Exceptional 5.8% |
| Australians | 98.8 /100 | #90 | Exceptional 5.8% |
| Immigrants | Sudan | 98.8 /100 | #91 | Exceptional 5.8% |
| Immigrants | Sierra Leone | 98.6 /100 | #92 | Exceptional 5.8% |
| Immigrants | Denmark | 98.6 /100 | #93 | Exceptional 5.8% |
| Kenyans | 98.4 /100 | #94 | Exceptional 5.8% |
| Immigrants | El Salvador | 98.4 /100 | #95 | Exceptional 5.8% |
Demographics Similar to Chickasaw by Ambulatory Disability
In terms of ambulatory disability, the demographic groups most similar to Chickasaw are Seminole (8.0%, a difference of 0.070%), Yuman (7.9%, a difference of 1.1%), Dutch West Indian (8.2%, a difference of 1.7%), Cherokee (7.9%, a difference of 2.1%), and Colville (8.2%, a difference of 2.3%).
| Demographics | Rating | Rank | Ambulatory Disability |
| Hopi | 0.0 /100 | #328 | Tragic 7.6% |
| Pueblo | 0.0 /100 | #329 | Tragic 7.6% |
| Paiute | 0.0 /100 | #330 | Tragic 7.7% |
| Cajuns | 0.0 /100 | #331 | Tragic 7.8% |
| Menominee | 0.0 /100 | #332 | Tragic 7.8% |
| Cherokee | 0.0 /100 | #333 | Tragic 7.9% |
| Yuman | 0.0 /100 | #334 | Tragic 7.9% |
| Chickasaw | 0.0 /100 | #335 | Tragic 8.0% |
| Seminole | 0.0 /100 | #336 | Tragic 8.0% |
| Dutch West Indians | 0.0 /100 | #337 | Tragic 8.2% |
| Colville | 0.0 /100 | #338 | Tragic 8.2% |
| Pima | 0.0 /100 | #339 | Tragic 8.2% |
| Choctaw | 0.0 /100 | #340 | Tragic 8.3% |
| Creek | 0.0 /100 | #341 | Tragic 8.5% |
| Kiowa | 0.0 /100 | #342 | Tragic 8.6% |