South African vs Immigrants from Kenya Hearing Disability
COMPARE
South African
Immigrants from Kenya
Hearing Disability
Hearing Disability Comparison
South Africans
Immigrants from Kenya
3.1%
HEARING DISABILITY
24.5/ 100
METRIC RATING
194th/ 347
METRIC RANK
2.9%
HEARING DISABILITY
86.1/ 100
METRIC RATING
131st/ 347
METRIC RANK
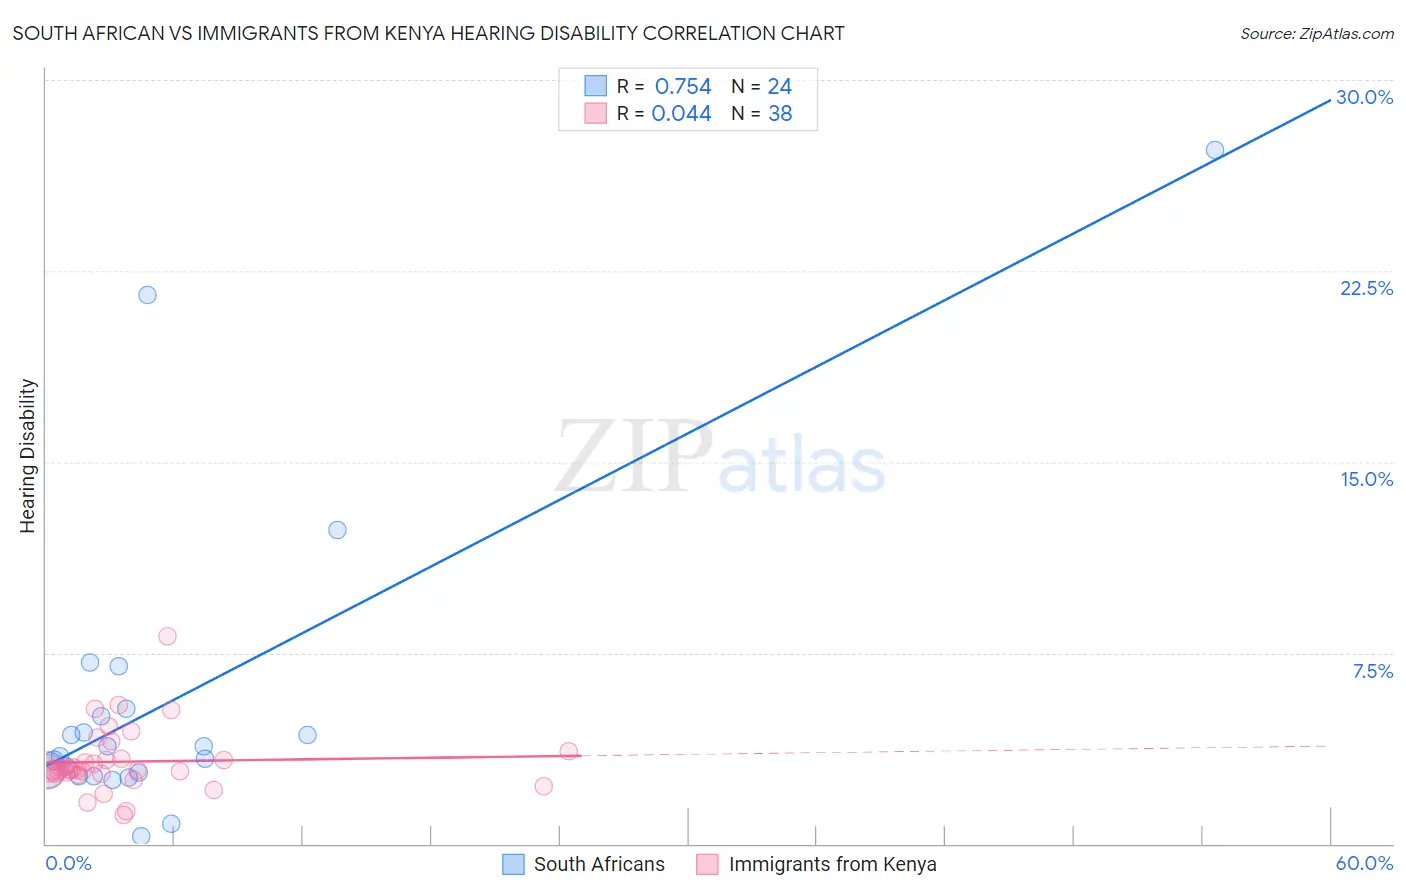
South African vs Immigrants from Kenya Hearing Disability Correlation Chart
The statistical analysis conducted on geographies consisting of 182,558,615 people shows a strong positive correlation between the proportion of South Africans and percentage of population with hearing disability in the United States with a correlation coefficient (R) of 0.754 and weighted average of 3.1%. Similarly, the statistical analysis conducted on geographies consisting of 218,040,031 people shows no correlation between the proportion of Immigrants from Kenya and percentage of population with hearing disability in the United States with a correlation coefficient (R) of 0.044 and weighted average of 2.9%, a difference of 7.2%.
Hearing Disability Correlation Summary
| Measurement | South African | Immigrants from Kenya |
| Minimum | 0.31% | 1.1% |
| Maximum | 27.3% | 8.1% |
| Range | 27.0% | 7.0% |
| Mean | 5.7% | 3.2% |
| Median | 3.6% | 2.9% |
| Interquartile 25% (IQ1) | 2.7% | 2.8% |
| Interquartile 75% (IQ3) | 5.2% | 3.3% |
| Interquartile Range (IQR) | 2.4% | 0.57% |
| Standard Deviation (Sample) | 6.3% | 1.3% |
| Standard Deviation (Population) | 6.2% | 1.3% |
Similar Demographics by Hearing Disability
Demographics Similar to South Africans by Hearing Disability
In terms of hearing disability, the demographic groups most similar to South Africans are Spanish American Indian (3.1%, a difference of 0.050%), Immigrants from Europe (3.1%, a difference of 0.21%), Macedonian (3.1%, a difference of 0.30%), Korean (3.1%, a difference of 0.37%), and Immigrants from Switzerland (3.1%, a difference of 0.51%).
| Demographics | Rating | Rank | Hearing Disability |
| Blacks/African Americans | 34.7 /100 | #187 | Fair 3.0% |
| Mexican American Indians | 34.7 /100 | #188 | Fair 3.0% |
| Africans | 32.9 /100 | #189 | Fair 3.0% |
| Immigrants | South Africa | 31.1 /100 | #190 | Fair 3.1% |
| Immigrants | Switzerland | 28.8 /100 | #191 | Fair 3.1% |
| Koreans | 27.6 /100 | #192 | Fair 3.1% |
| Macedonians | 27.0 /100 | #193 | Fair 3.1% |
| South Africans | 24.5 /100 | #194 | Fair 3.1% |
| Spanish American Indians | 24.1 /100 | #195 | Fair 3.1% |
| Immigrants | Europe | 22.9 /100 | #196 | Fair 3.1% |
| Immigrants | Bosnia and Herzegovina | 20.6 /100 | #197 | Fair 3.1% |
| Immigrants | Croatia | 20.5 /100 | #198 | Fair 3.1% |
| Syrians | 19.2 /100 | #199 | Poor 3.1% |
| Immigrants | North Macedonia | 19.1 /100 | #200 | Poor 3.1% |
| Iraqis | 19.0 /100 | #201 | Poor 3.1% |
Demographics Similar to Immigrants from Kenya by Hearing Disability
In terms of hearing disability, the demographic groups most similar to Immigrants from Kenya are Chilean (2.9%, a difference of 0.050%), Immigrants from Syria (2.9%, a difference of 0.060%), Immigrants from Vietnam (2.9%, a difference of 0.090%), Immigrants from Uganda (2.9%, a difference of 0.10%), and Ugandan (2.9%, a difference of 0.13%).
| Demographics | Rating | Rank | Hearing Disability |
| Bahamians | 88.6 /100 | #124 | Excellent 2.9% |
| Immigrants | Albania | 88.5 /100 | #125 | Excellent 2.9% |
| Immigrants | Sudan | 87.8 /100 | #126 | Excellent 2.9% |
| South American Indians | 86.9 /100 | #127 | Excellent 2.9% |
| Immigrants | Western Asia | 86.9 /100 | #128 | Excellent 2.9% |
| Immigrants | Uganda | 86.6 /100 | #129 | Excellent 2.9% |
| Immigrants | Vietnam | 86.5 /100 | #130 | Excellent 2.9% |
| Immigrants | Kenya | 86.1 /100 | #131 | Excellent 2.9% |
| Chileans | 85.8 /100 | #132 | Excellent 2.9% |
| Immigrants | Syria | 85.8 /100 | #133 | Excellent 2.9% |
| Ugandans | 85.5 /100 | #134 | Excellent 2.9% |
| Soviet Union | 84.8 /100 | #135 | Excellent 2.9% |
| Immigrants | Brazil | 84.6 /100 | #136 | Excellent 2.9% |
| Sri Lankans | 84.1 /100 | #137 | Excellent 2.9% |
| Immigrants | Costa Rica | 84.0 /100 | #138 | Excellent 2.9% |