South African vs Austrian Hearing Disability
COMPARE
South African
Austrian
Hearing Disability
Hearing Disability Comparison
South Africans
Austrians
3.1%
HEARING DISABILITY
24.5/ 100
METRIC RATING
194th/ 347
METRIC RANK
3.4%
HEARING DISABILITY
0.6/ 100
METRIC RATING
248th/ 347
METRIC RANK
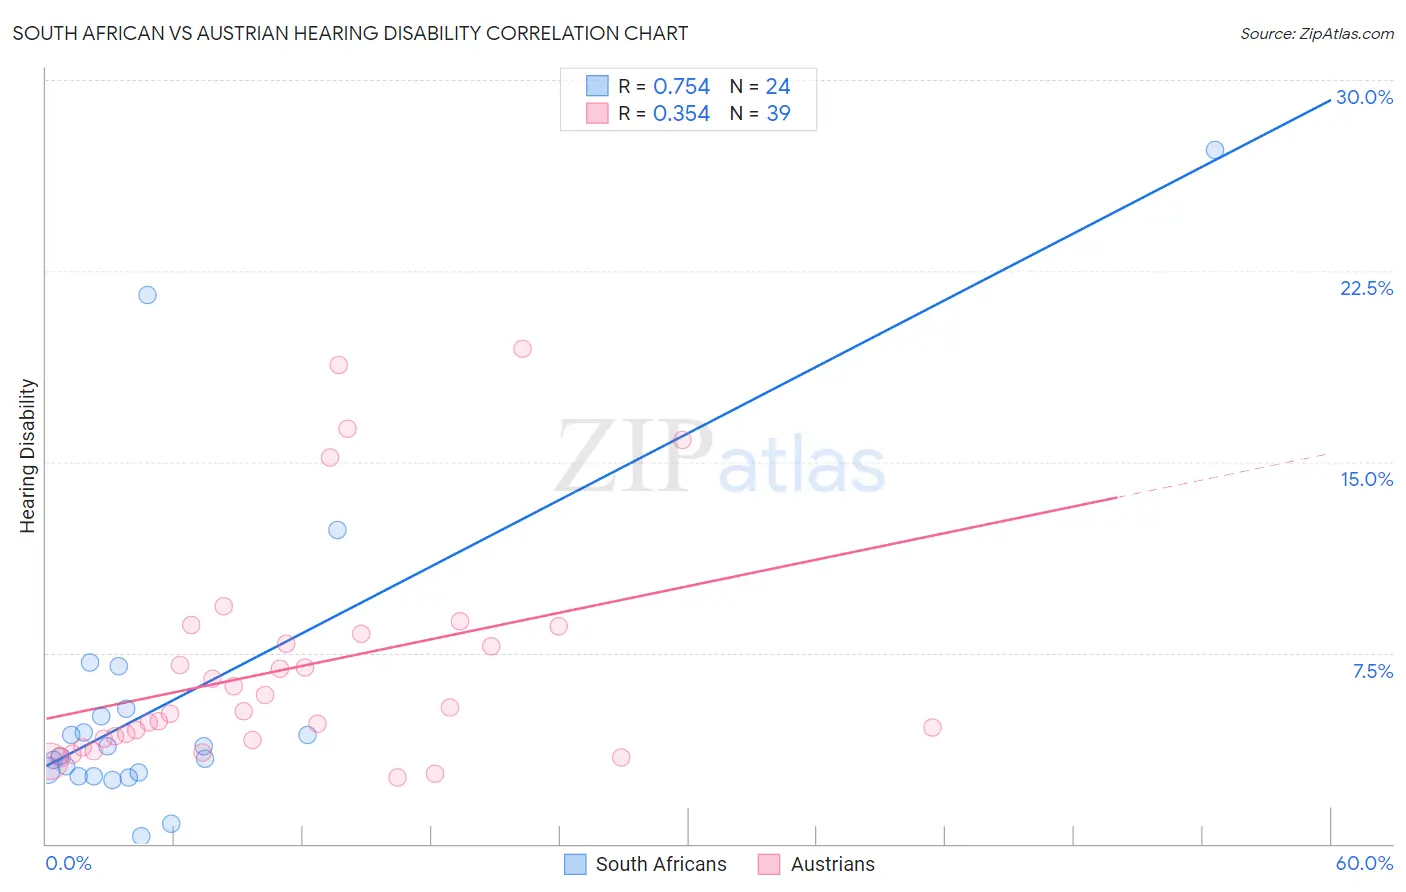
South African vs Austrian Hearing Disability Correlation Chart
The statistical analysis conducted on geographies consisting of 182,558,615 people shows a strong positive correlation between the proportion of South Africans and percentage of population with hearing disability in the United States with a correlation coefficient (R) of 0.754 and weighted average of 3.1%. Similarly, the statistical analysis conducted on geographies consisting of 451,912,592 people shows a mild positive correlation between the proportion of Austrians and percentage of population with hearing disability in the United States with a correlation coefficient (R) of 0.354 and weighted average of 3.4%, a difference of 9.3%.
Hearing Disability Correlation Summary
| Measurement | South African | Austrian |
| Minimum | 0.31% | 2.6% |
| Maximum | 27.3% | 19.4% |
| Range | 27.0% | 16.9% |
| Mean | 5.7% | 6.9% |
| Median | 3.6% | 5.2% |
| Interquartile 25% (IQ1) | 2.7% | 4.1% |
| Interquartile 75% (IQ3) | 5.2% | 8.2% |
| Interquartile Range (IQR) | 2.4% | 4.2% |
| Standard Deviation (Sample) | 6.3% | 4.4% |
| Standard Deviation (Population) | 6.2% | 4.3% |
Similar Demographics by Hearing Disability
Demographics Similar to South Africans by Hearing Disability
In terms of hearing disability, the demographic groups most similar to South Africans are Spanish American Indian (3.1%, a difference of 0.050%), Immigrants from Europe (3.1%, a difference of 0.21%), Macedonian (3.1%, a difference of 0.30%), Korean (3.1%, a difference of 0.37%), and Immigrants from Switzerland (3.1%, a difference of 0.51%).
| Demographics | Rating | Rank | Hearing Disability |
| Blacks/African Americans | 34.7 /100 | #187 | Fair 3.0% |
| Mexican American Indians | 34.7 /100 | #188 | Fair 3.0% |
| Africans | 32.9 /100 | #189 | Fair 3.0% |
| Immigrants | South Africa | 31.1 /100 | #190 | Fair 3.1% |
| Immigrants | Switzerland | 28.8 /100 | #191 | Fair 3.1% |
| Koreans | 27.6 /100 | #192 | Fair 3.1% |
| Macedonians | 27.0 /100 | #193 | Fair 3.1% |
| South Africans | 24.5 /100 | #194 | Fair 3.1% |
| Spanish American Indians | 24.1 /100 | #195 | Fair 3.1% |
| Immigrants | Europe | 22.9 /100 | #196 | Fair 3.1% |
| Immigrants | Bosnia and Herzegovina | 20.6 /100 | #197 | Fair 3.1% |
| Immigrants | Croatia | 20.5 /100 | #198 | Fair 3.1% |
| Syrians | 19.2 /100 | #199 | Poor 3.1% |
| Immigrants | North Macedonia | 19.1 /100 | #200 | Poor 3.1% |
| Iraqis | 19.0 /100 | #201 | Poor 3.1% |
Demographics Similar to Austrians by Hearing Disability
In terms of hearing disability, the demographic groups most similar to Austrians are Lithuanian (3.4%, a difference of 0.22%), Immigrants from England (3.3%, a difference of 0.42%), Italian (3.4%, a difference of 0.53%), Yuman (3.4%, a difference of 0.54%), and Immigrants from Scotland (3.3%, a difference of 0.71%).
| Demographics | Rating | Rank | Hearing Disability |
| Samoans | 1.1 /100 | #241 | Tragic 3.3% |
| Yugoslavians | 1.0 /100 | #242 | Tragic 3.3% |
| Immigrants | Western Europe | 1.0 /100 | #243 | Tragic 3.3% |
| Assyrians/Chaldeans/Syriacs | 0.9 /100 | #244 | Tragic 3.3% |
| Immigrants | Scotland | 0.8 /100 | #245 | Tragic 3.3% |
| Immigrants | England | 0.7 /100 | #246 | Tragic 3.3% |
| Lithuanians | 0.6 /100 | #247 | Tragic 3.4% |
| Austrians | 0.6 /100 | #248 | Tragic 3.4% |
| Italians | 0.4 /100 | #249 | Tragic 3.4% |
| Yuman | 0.4 /100 | #250 | Tragic 3.4% |
| Hungarians | 0.4 /100 | #251 | Tragic 3.4% |
| Croatians | 0.4 /100 | #252 | Tragic 3.4% |
| Carpatho Rusyns | 0.3 /100 | #253 | Tragic 3.4% |
| Slavs | 0.2 /100 | #254 | Tragic 3.4% |
| Poles | 0.2 /100 | #255 | Tragic 3.4% |