Slovene vs Immigrants from Europe Hearing Disability
COMPARE
Slovene
Immigrants from Europe
Hearing Disability
Hearing Disability Comparison
Slovenes
Immigrants from Europe
3.5%
HEARING DISABILITY
0.1/ 100
METRIC RATING
259th/ 347
METRIC RANK
3.1%
HEARING DISABILITY
22.9/ 100
METRIC RATING
196th/ 347
METRIC RANK
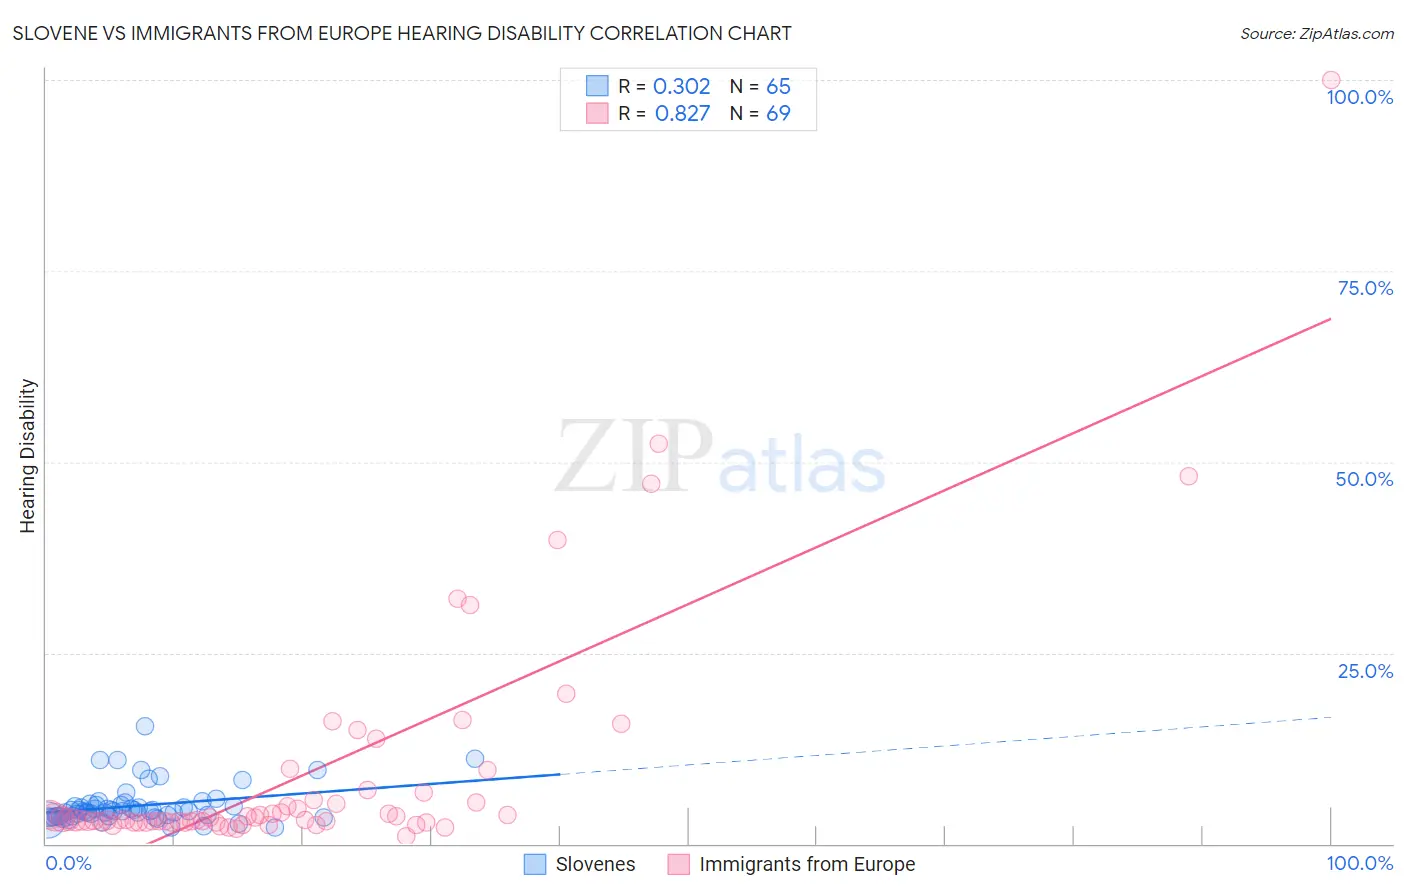
Slovene vs Immigrants from Europe Hearing Disability Correlation Chart
The statistical analysis conducted on geographies consisting of 261,288,798 people shows a mild positive correlation between the proportion of Slovenes and percentage of population with hearing disability in the United States with a correlation coefficient (R) of 0.302 and weighted average of 3.5%. Similarly, the statistical analysis conducted on geographies consisting of 546,917,767 people shows a very strong positive correlation between the proportion of Immigrants from Europe and percentage of population with hearing disability in the United States with a correlation coefficient (R) of 0.827 and weighted average of 3.1%, a difference of 12.2%.
Hearing Disability Correlation Summary
| Measurement | Slovene | Immigrants from Europe |
| Minimum | 2.2% | 0.95% |
| Maximum | 15.4% | 100.0% |
| Range | 13.2% | 99.1% |
| Mean | 5.0% | 9.4% |
| Median | 4.3% | 3.2% |
| Interquartile 25% (IQ1) | 3.6% | 2.9% |
| Interquartile 75% (IQ3) | 5.1% | 6.2% |
| Interquartile Range (IQR) | 1.5% | 3.3% |
| Standard Deviation (Sample) | 2.5% | 15.9% |
| Standard Deviation (Population) | 2.4% | 15.8% |
Similar Demographics by Hearing Disability
Demographics Similar to Slovenes by Hearing Disability
In terms of hearing disability, the demographic groups most similar to Slovenes are Portuguese (3.5%, a difference of 0.080%), Hawaiian (3.5%, a difference of 0.11%), Immigrants from North America (3.5%, a difference of 0.23%), Northern European (3.4%, a difference of 0.24%), and Immigrants from Canada (3.5%, a difference of 0.27%).
| Demographics | Rating | Rank | Hearing Disability |
| Croatians | 0.4 /100 | #252 | Tragic 3.4% |
| Carpatho Rusyns | 0.3 /100 | #253 | Tragic 3.4% |
| Slavs | 0.2 /100 | #254 | Tragic 3.4% |
| Poles | 0.2 /100 | #255 | Tragic 3.4% |
| Hmong | 0.2 /100 | #256 | Tragic 3.4% |
| Yaqui | 0.2 /100 | #257 | Tragic 3.4% |
| Northern Europeans | 0.2 /100 | #258 | Tragic 3.4% |
| Slovenes | 0.1 /100 | #259 | Tragic 3.5% |
| Portuguese | 0.1 /100 | #260 | Tragic 3.5% |
| Hawaiians | 0.1 /100 | #261 | Tragic 3.5% |
| Immigrants | North America | 0.1 /100 | #262 | Tragic 3.5% |
| Immigrants | Canada | 0.1 /100 | #263 | Tragic 3.5% |
| Immigrants | Germany | 0.1 /100 | #264 | Tragic 3.5% |
| British | 0.1 /100 | #265 | Tragic 3.5% |
| Belgians | 0.1 /100 | #266 | Tragic 3.5% |
Demographics Similar to Immigrants from Europe by Hearing Disability
In terms of hearing disability, the demographic groups most similar to Immigrants from Europe are Spanish American Indian (3.1%, a difference of 0.16%), South African (3.1%, a difference of 0.21%), Immigrants from Bosnia and Herzegovina (3.1%, a difference of 0.30%), Immigrants from Croatia (3.1%, a difference of 0.32%), and Macedonian (3.1%, a difference of 0.51%).
| Demographics | Rating | Rank | Hearing Disability |
| Africans | 32.9 /100 | #189 | Fair 3.0% |
| Immigrants | South Africa | 31.1 /100 | #190 | Fair 3.1% |
| Immigrants | Switzerland | 28.8 /100 | #191 | Fair 3.1% |
| Koreans | 27.6 /100 | #192 | Fair 3.1% |
| Macedonians | 27.0 /100 | #193 | Fair 3.1% |
| South Africans | 24.5 /100 | #194 | Fair 3.1% |
| Spanish American Indians | 24.1 /100 | #195 | Fair 3.1% |
| Immigrants | Europe | 22.9 /100 | #196 | Fair 3.1% |
| Immigrants | Bosnia and Herzegovina | 20.6 /100 | #197 | Fair 3.1% |
| Immigrants | Croatia | 20.5 /100 | #198 | Fair 3.1% |
| Syrians | 19.2 /100 | #199 | Poor 3.1% |
| Immigrants | North Macedonia | 19.1 /100 | #200 | Poor 3.1% |
| Iraqis | 19.0 /100 | #201 | Poor 3.1% |
| Immigrants | Thailand | 16.4 /100 | #202 | Poor 3.1% |
| Immigrants | Denmark | 16.2 /100 | #203 | Poor 3.1% |