Slovak vs Barbadian Disability Age 35 to 64
COMPARE
Slovak
Barbadian
Disability Age 35 to 64
Disability Age 35 to 64 Comparison
Slovaks
Barbadians
12.1%
DISABILITY AGE 35 TO 64
2.7/ 100
METRIC RATING
243rd/ 347
METRIC RANK
11.8%
DISABILITY AGE 35 TO 64
9.5/ 100
METRIC RATING
217th/ 347
METRIC RANK
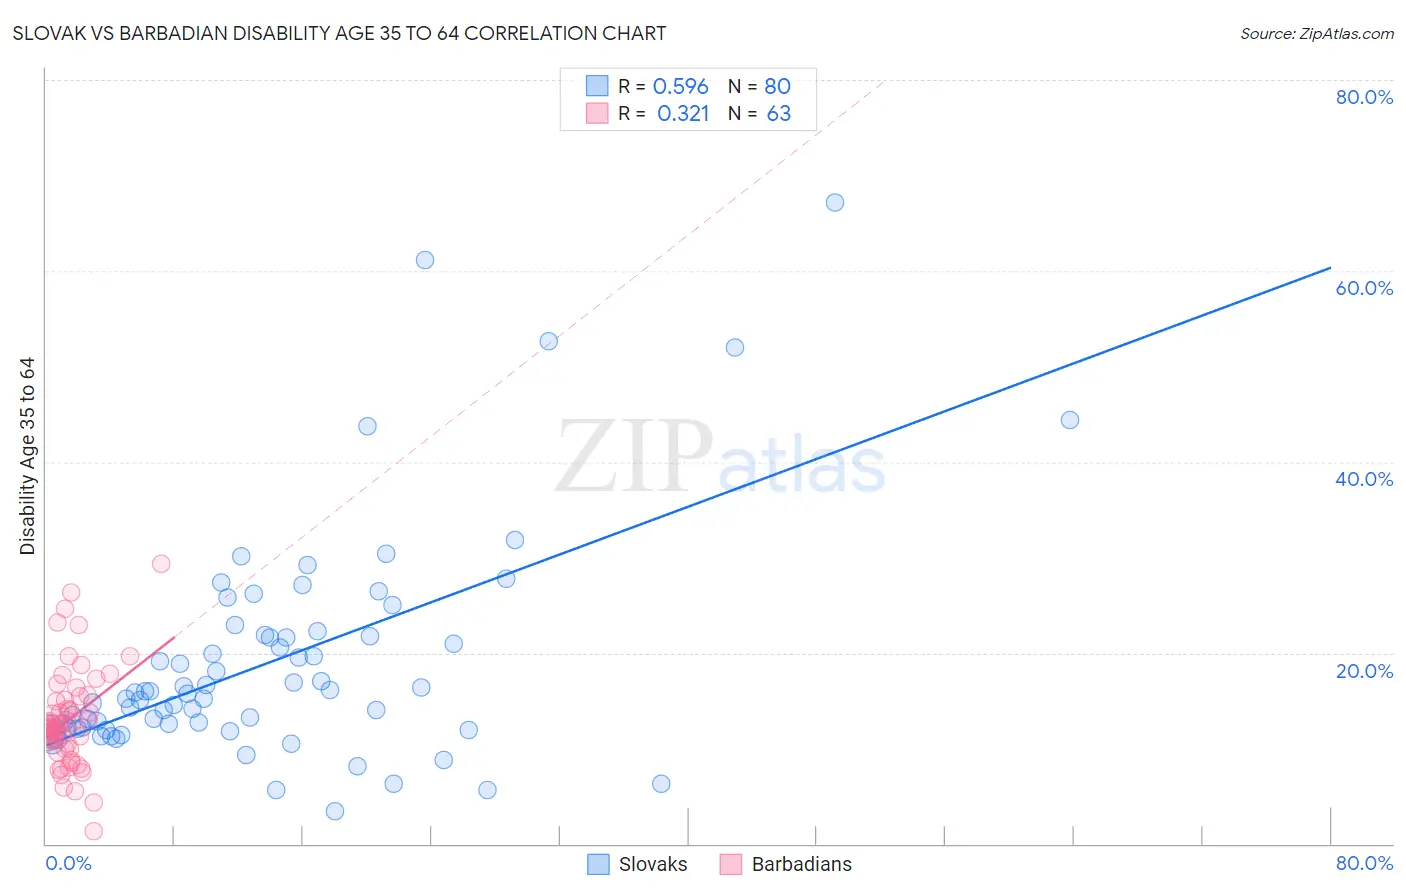
Slovak vs Barbadian Disability Age 35 to 64 Correlation Chart
The statistical analysis conducted on geographies consisting of 397,624,884 people shows a substantial positive correlation between the proportion of Slovaks and percentage of population with a disability between the ages 34 and 64 in the United States with a correlation coefficient (R) of 0.596 and weighted average of 12.1%. Similarly, the statistical analysis conducted on geographies consisting of 141,271,675 people shows a mild positive correlation between the proportion of Barbadians and percentage of population with a disability between the ages 34 and 64 in the United States with a correlation coefficient (R) of 0.321 and weighted average of 11.8%, a difference of 2.6%.
Disability Age 35 to 64 Correlation Summary
| Measurement | Slovak | Barbadian |
| Minimum | 3.4% | 1.4% |
| Maximum | 67.2% | 29.3% |
| Range | 63.8% | 27.9% |
| Mean | 19.1% | 13.0% |
| Median | 15.8% | 12.2% |
| Interquartile 25% (IQ1) | 12.1% | 9.9% |
| Interquartile 75% (IQ3) | 21.8% | 15.1% |
| Interquartile Range (IQR) | 9.7% | 5.2% |
| Standard Deviation (Sample) | 11.9% | 5.1% |
| Standard Deviation (Population) | 11.8% | 5.1% |
Similar Demographics by Disability Age 35 to 64
Demographics Similar to Slovaks by Disability Age 35 to 64
In terms of disability age 35 to 64, the demographic groups most similar to Slovaks are Samoan (12.1%, a difference of 0.10%), Finnish (12.1%, a difference of 0.26%), Immigrants from Mexico (12.1%, a difference of 0.36%), Mexican American Indian (12.0%, a difference of 0.37%), and Immigrants from Thailand (12.0%, a difference of 0.39%).
| Demographics | Rating | Rank | Disability Age 35 to 64 |
| Immigrants | Middle Africa | 4.5 /100 | #236 | Tragic 12.0% |
| Immigrants | Cambodia | 3.9 /100 | #237 | Tragic 12.0% |
| West Indians | 3.7 /100 | #238 | Tragic 12.0% |
| Immigrants | Western Africa | 3.3 /100 | #239 | Tragic 12.0% |
| Immigrants | Thailand | 3.3 /100 | #240 | Tragic 12.0% |
| Mexican American Indians | 3.2 /100 | #241 | Tragic 12.0% |
| Samoans | 2.8 /100 | #242 | Tragic 12.1% |
| Slovaks | 2.7 /100 | #243 | Tragic 12.1% |
| Finns | 2.3 /100 | #244 | Tragic 12.1% |
| Immigrants | Mexico | 2.2 /100 | #245 | Tragic 12.1% |
| Guamanians/Chamorros | 1.4 /100 | #246 | Tragic 12.2% |
| Immigrants | Senegal | 1.3 /100 | #247 | Tragic 12.2% |
| Spaniards | 1.3 /100 | #248 | Tragic 12.3% |
| Hispanics or Latinos | 1.3 /100 | #249 | Tragic 12.3% |
| Immigrants | Burma/Myanmar | 1.2 /100 | #250 | Tragic 12.3% |
Demographics Similar to Barbadians by Disability Age 35 to 64
In terms of disability age 35 to 64, the demographic groups most similar to Barbadians are Immigrants from Bahamas (11.8%, a difference of 0.050%), Czechoslovakian (11.8%, a difference of 0.10%), Immigrants from West Indies (11.8%, a difference of 0.14%), Alsatian (11.8%, a difference of 0.23%), and Honduran (11.8%, a difference of 0.25%).
| Demographics | Rating | Rank | Disability Age 35 to 64 |
| Belgians | 13.1 /100 | #210 | Poor 11.7% |
| Canadians | 13.0 /100 | #211 | Poor 11.7% |
| Immigrants | Jamaica | 11.8 /100 | #212 | Poor 11.7% |
| Yugoslavians | 11.6 /100 | #213 | Poor 11.7% |
| Immigrants | Sudan | 11.4 /100 | #214 | Poor 11.7% |
| Spanish American Indians | 11.1 /100 | #215 | Poor 11.7% |
| Bahamians | 10.7 /100 | #216 | Poor 11.8% |
| Barbadians | 9.5 /100 | #217 | Tragic 11.8% |
| Immigrants | Bahamas | 9.2 /100 | #218 | Tragic 11.8% |
| Czechoslovakians | 9.0 /100 | #219 | Tragic 11.8% |
| Immigrants | West Indies | 8.9 /100 | #220 | Tragic 11.8% |
| Alsatians | 8.5 /100 | #221 | Tragic 11.8% |
| Hondurans | 8.4 /100 | #222 | Tragic 11.8% |
| Immigrants | Honduras | 8.4 /100 | #223 | Tragic 11.8% |
| Immigrants | Ghana | 7.8 /100 | #224 | Tragic 11.8% |