British vs Barbadian Disability Age 35 to 64
COMPARE
British
Barbadian
Disability Age 35 to 64
Disability Age 35 to 64 Comparison
British
Barbadians
11.6%
DISABILITY AGE 35 TO 64
17.0/ 100
METRIC RATING
203rd/ 347
METRIC RANK
11.8%
DISABILITY AGE 35 TO 64
9.5/ 100
METRIC RATING
217th/ 347
METRIC RANK
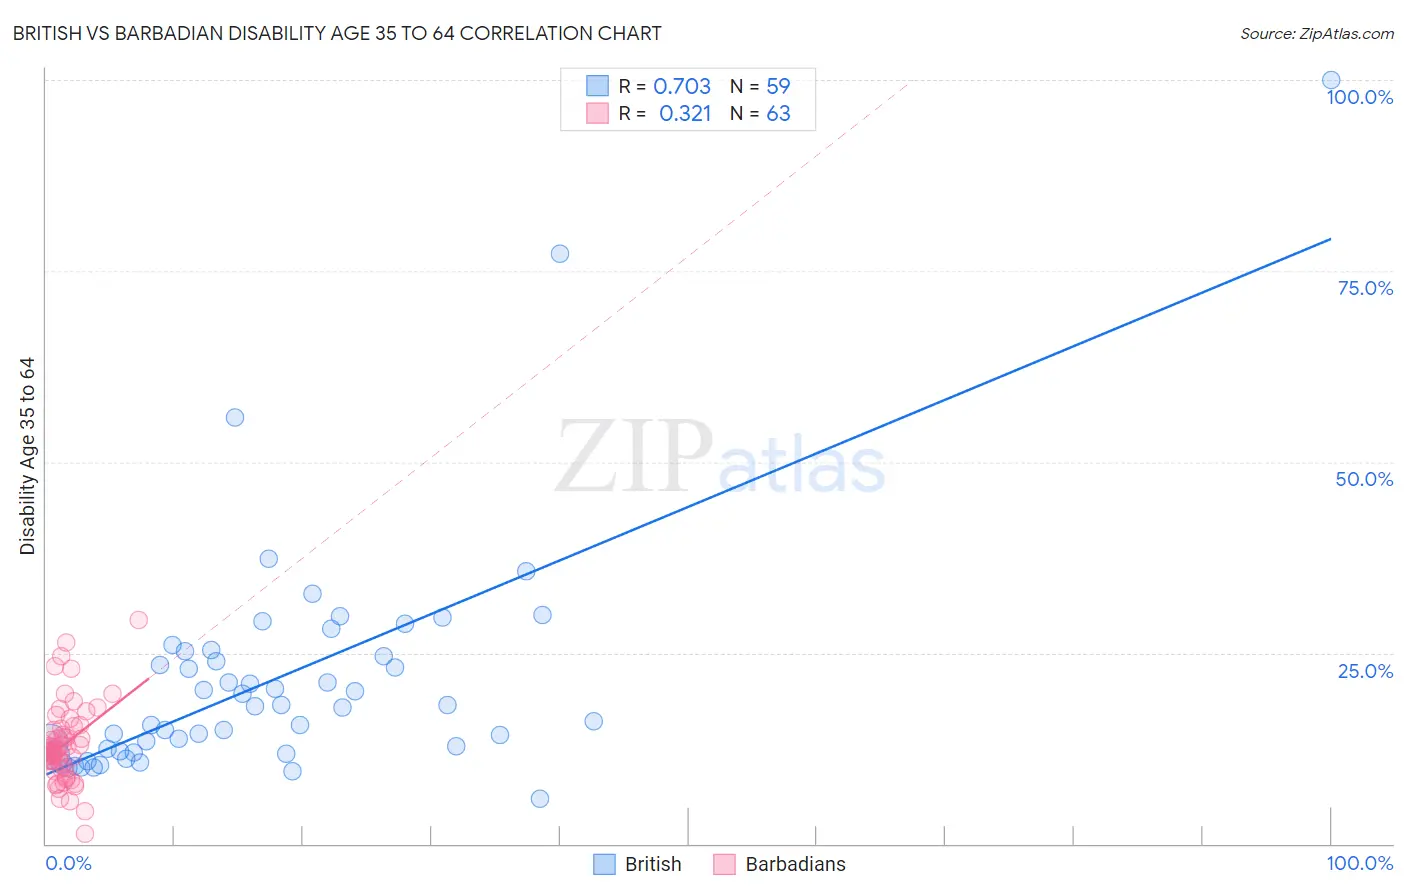
British vs Barbadian Disability Age 35 to 64 Correlation Chart
The statistical analysis conducted on geographies consisting of 530,788,886 people shows a strong positive correlation between the proportion of British and percentage of population with a disability between the ages 34 and 64 in the United States with a correlation coefficient (R) of 0.703 and weighted average of 11.6%. Similarly, the statistical analysis conducted on geographies consisting of 141,271,675 people shows a mild positive correlation between the proportion of Barbadians and percentage of population with a disability between the ages 34 and 64 in the United States with a correlation coefficient (R) of 0.321 and weighted average of 11.8%, a difference of 1.3%.
Disability Age 35 to 64 Correlation Summary
| Measurement | British | Barbadian |
| Minimum | 5.9% | 1.4% |
| Maximum | 100.0% | 29.3% |
| Range | 94.1% | 27.9% |
| Mean | 21.5% | 13.0% |
| Median | 18.1% | 12.2% |
| Interquartile 25% (IQ1) | 12.1% | 9.9% |
| Interquartile 75% (IQ3) | 25.2% | 15.1% |
| Interquartile Range (IQR) | 13.2% | 5.2% |
| Standard Deviation (Sample) | 15.6% | 5.1% |
| Standard Deviation (Population) | 15.4% | 5.1% |
Demographics Similar to British and Barbadians by Disability Age 35 to 64
In terms of disability age 35 to 64, the demographic groups most similar to British are Immigrants from Guatemala (11.6%, a difference of 0.060%), Immigrants from Kenya (11.6%, a difference of 0.090%), Nigerian (11.6%, a difference of 0.11%), Swiss (11.6%, a difference of 0.22%), and Slavic (11.7%, a difference of 0.22%). Similarly, the demographic groups most similar to Barbadians are Immigrants from Bahamas (11.8%, a difference of 0.050%), Czechoslovakian (11.8%, a difference of 0.10%), Immigrants from West Indies (11.8%, a difference of 0.14%), Bahamian (11.8%, a difference of 0.26%), and Spanish American Indian (11.7%, a difference of 0.35%).
| Demographics | Rating | Rank | Disability Age 35 to 64 |
| Swiss | 18.7 /100 | #200 | Poor 11.6% |
| Immigrants | Kenya | 17.7 /100 | #201 | Poor 11.6% |
| Immigrants | Guatemala | 17.5 /100 | #202 | Poor 11.6% |
| British | 17.0 /100 | #203 | Poor 11.6% |
| Nigerians | 16.3 /100 | #204 | Poor 11.6% |
| Slavs | 15.5 /100 | #205 | Poor 11.7% |
| Native Hawaiians | 14.8 /100 | #206 | Poor 11.7% |
| Ghanaians | 14.8 /100 | #207 | Poor 11.7% |
| Guatemalans | 14.6 /100 | #208 | Poor 11.7% |
| Europeans | 13.5 /100 | #209 | Poor 11.7% |
| Belgians | 13.1 /100 | #210 | Poor 11.7% |
| Canadians | 13.0 /100 | #211 | Poor 11.7% |
| Immigrants | Jamaica | 11.8 /100 | #212 | Poor 11.7% |
| Yugoslavians | 11.6 /100 | #213 | Poor 11.7% |
| Immigrants | Sudan | 11.4 /100 | #214 | Poor 11.7% |
| Spanish American Indians | 11.1 /100 | #215 | Poor 11.7% |
| Bahamians | 10.7 /100 | #216 | Poor 11.8% |
| Barbadians | 9.5 /100 | #217 | Tragic 11.8% |
| Immigrants | Bahamas | 9.2 /100 | #218 | Tragic 11.8% |
| Czechoslovakians | 9.0 /100 | #219 | Tragic 11.8% |
| Immigrants | West Indies | 8.9 /100 | #220 | Tragic 11.8% |