Sierra Leonean vs Immigrants from Taiwan Female Disability

COMPARE

Sierra Leonean
Race
Ancestry
AfghanAfricanAlaska NativeAlaskan AthabascanAlbanianAleutAlsatianAmericanApacheArabArapahoArgentineanArmenianAssyrian/Chaldean/SyriacAustralianAustrianBahamianBangladeshiBarbadianBasqueBelgianBelizeanBermudanBhutaneseBlackfeetBolivianBrazilianBritishBritish West IndianBulgarianBurmeseCajunCambodianCanadianCape VerdeanCarpatho RusynCelticCentral AmericanCentral American IndianCherokeeCheyenneChickasawChileanChineseChippewaChoctawColombianColvilleComancheCosta RicanCreeCreekCroatianCrowCubanCypriotCzechCzechoslovakianDanishDelawareDominicanDutchDutch West IndianEastern EuropeanEcuadorianEgyptianEnglishEstonianEthiopianEuropeanFijianFilipinoFinnishFrenchFrench American IndianFrench CanadianGermanGerman RussianGhanaianGreekGuamanian/ChamorroGuatemalanGuyaneseHaitianHmongHonduranHopiHoumaHungarianIcelanderIndian (Asian)IndonesianInupiatIranianIraqiIrishIroquoisIsraeliItalianJamaicanJapaneseJordanianKenyanKiowaKoreanLaotianLatvianLebaneseLiberianLithuanianLumbeeLuxembourgerMacedonianMalaysianMalteseMarshalleseMenomineeMexicanMexican American IndianMongolianMoroccanNative HawaiianNavajoNepaleseNew ZealanderNicaraguanNigerianNorthern EuropeanNorwegianOkinawanOsageOttawaPaiutePakistaniPalestinianPanamanianParaguayanPennsylvania GermanPeruvianPimaPolishPortuguesePotawatomiPuebloPuerto RicanPuget Sound SalishRomanianRussianSalvadoranSamoanScandinavianScotch-IrishScottishSeminoleSenegaleseSerbianShoshoneSierra LeoneanSiouxSlavicSlovakSloveneSomaliSouth AfricanSouth AmericanSouth American IndianSoviet UnionSpaniardSpanishSpanish AmericanSpanish American IndianSri LankanSubsaharan AfricanSudaneseSwedishSwissSyrianTaiwaneseThaiTlingit-HaidaTohono O'OdhamTonganTrinidadian and TobagonianTsimshianTurkishU.S. Virgin IslanderUgandanUkrainianUruguayanUteVenezuelanVietnameseWelshWest IndianYakamaYaquiYugoslavianYumanYup'ikZimbabwean
Immigration
NonimmigrantsImmigrantsAfghanistanAfricaAlbaniaArgentinaArmeniaAsiaAustraliaAustriaBahamasBangladeshBarbadosBelarusBelgiumBelizeBoliviaBosnia and HerzegovinaBrazilBulgariaBurma/MyanmarCabo VerdeCambodiaCameroonCanadaCaribbeanCentral AmericaChileChinaColombiaCongoCosta RicaCroatiaCubaCzechoslovakiaDenmarkDominicaDominican RepublicEastern AfricaEastern AsiaEastern EuropeEcuadorEgyptEl SalvadorEnglandEritreaEthiopiaEuropeFijiFranceGermanyGhanaGreeceGrenadaGuatemalaGuyanaHaitiHondurasHong KongHungaryIndiaIndonesiaIranIraqIrelandIsraelItalyJamaicaJapanJordanKazakhstanKenyaKoreaKuwaitLaosLatin AmericaLatviaLebanonLiberiaLithuaniaMalaysiaMexicoMicronesiaMiddle AfricaMoldovaMoroccoNepalNetherlandsNicaraguaNigeriaNorth AmericaNorth MacedoniaNorthern AfricaNorthern EuropeNorwayOceaniaPakistanPanamaPeruPhilippinesPolandPortugalRomaniaRussiaSaudi ArabiaScotlandSenegalSerbiaSierra LeoneSingaporeSomaliaSouth AfricaSouth AmericaSouth Central AsiaSouth Eastern AsiaSouthern EuropeSpainSri LankaSt. Vincent and the GrenadinesSudanSwedenSwitzerlandSyriaThailandTrinidad and TobagoTurkeyUgandaUkraineUruguayUzbekistanVenezuelaVietnamWest IndiesWestern AfricaWestern AsiaWestern EuropeYemenZaireZimbabweAzores
Immigrants from Taiwan
Race
Ancestry
AfghanAfricanAlaska NativeAlaskan AthabascanAlbanianAleutAlsatianAmericanApacheArabArapahoArgentineanArmenianAssyrian/Chaldean/SyriacAustralianAustrianBahamianBangladeshiBarbadianBasqueBelgianBelizeanBermudanBhutaneseBlackfeetBolivianBrazilianBritishBritish West IndianBulgarianBurmeseCajunCambodianCanadianCape VerdeanCarpatho RusynCelticCentral AmericanCentral American IndianCherokeeCheyenneChickasawChileanChineseChippewaChoctawColombianColvilleComancheCosta RicanCreeCreekCroatianCrowCubanCypriotCzechCzechoslovakianDanishDelawareDominicanDutchDutch West IndianEastern EuropeanEcuadorianEgyptianEnglishEstonianEthiopianEuropeanFijianFilipinoFinnishFrenchFrench American IndianFrench CanadianGermanGerman RussianGhanaianGreekGuamanian/ChamorroGuatemalanGuyaneseHaitianHmongHonduranHopiHoumaHungarianIcelanderIndian (Asian)IndonesianInupiatIranianIraqiIrishIroquoisIsraeliItalianJamaicanJapaneseJordanianKenyanKiowaKoreanLaotianLatvianLebaneseLiberianLithuanianLumbeeLuxembourgerMacedonianMalaysianMalteseMarshalleseMenomineeMexicanMexican American IndianMongolianMoroccanNative HawaiianNavajoNepaleseNew ZealanderNicaraguanNigerianNorthern EuropeanNorwegianOkinawanOsageOttawaPaiutePakistaniPalestinianPanamanianParaguayanPennsylvania GermanPeruvianPimaPolishPortuguesePotawatomiPuebloPuerto RicanPuget Sound SalishRomanianRussianSalvadoranSamoanScandinavianScotch-IrishScottishSeminoleSenegaleseSerbianShoshoneSiouxSlavicSlovakSloveneSomaliSouth AfricanSouth AmericanSouth American IndianSoviet UnionSpaniardSpanishSpanish AmericanSpanish American IndianSri LankanSubsaharan AfricanSudaneseSwedishSwissSyrianTaiwaneseThaiTlingit-HaidaTohono O'OdhamTonganTrinidadian and TobagonianTsimshianTurkishU.S. Virgin IslanderUgandanUkrainianUruguayanUteVenezuelanVietnameseWelshWest IndianYakamaYaquiYugoslavianYumanYup'ikZimbabwean
Immigration
NonimmigrantsImmigrantsAfghanistanAfricaAlbaniaArgentinaArmeniaAsiaAustraliaAustriaBahamasBangladeshBarbadosBelarusBelgiumBelizeBoliviaBosnia and HerzegovinaBrazilBulgariaBurma/MyanmarCabo VerdeCambodiaCameroonCanadaCaribbeanCentral AmericaChileChinaColombiaCongoCosta RicaCroatiaCubaCzechoslovakiaDenmarkDominicaDominican RepublicEastern AfricaEastern AsiaEastern EuropeEcuadorEgyptEl SalvadorEnglandEritreaEthiopiaEuropeFijiFranceGermanyGhanaGreeceGrenadaGuatemalaGuyanaHaitiHondurasHong KongHungaryIndiaIndonesiaIranIraqIrelandIsraelItalyJamaicaJapanJordanKazakhstanKenyaKoreaKuwaitLaosLatin AmericaLatviaLebanonLiberiaLithuaniaMalaysiaMexicoMicronesiaMiddle AfricaMoldovaMoroccoNepalNetherlandsNicaraguaNigeriaNorth AmericaNorth MacedoniaNorthern AfricaNorthern EuropeNorwayOceaniaPakistanPanamaPeruPhilippinesPolandPortugalRomaniaRussiaSaudi ArabiaScotlandSenegalSerbiaSierra LeoneSingaporeSomaliaSouth AfricaSouth AmericaSouth Central AsiaSouth Eastern AsiaSouthern EuropeSpainSri LankaSt. Vincent and the GrenadinesSudanSwedenSwitzerlandSyriaTaiwanThailandTrinidad and TobagoTurkeyUgandaUkraineUruguayUzbekistanVenezuelaVietnamWest IndiesWestern AfricaWestern AsiaWestern EuropeYemenZaireZimbabweAzores
Female Disability
Income
Poverty
Unemployment
Labor Participation
Family Structure
Vehicle Availability
Education Level
Disability

Female Disability Comparison

Sierra Leoneans

Immigrants from Taiwan

Exceptional
Exceptional
11.5%
FEMALE DISABILITY
99.7/ 100
METRIC RATING
79th/ 347
METRIC RANK
10.1%
FEMALE DISABILITY
100.0/ 100
METRIC RATING
3rd/ 347
METRIC RANK

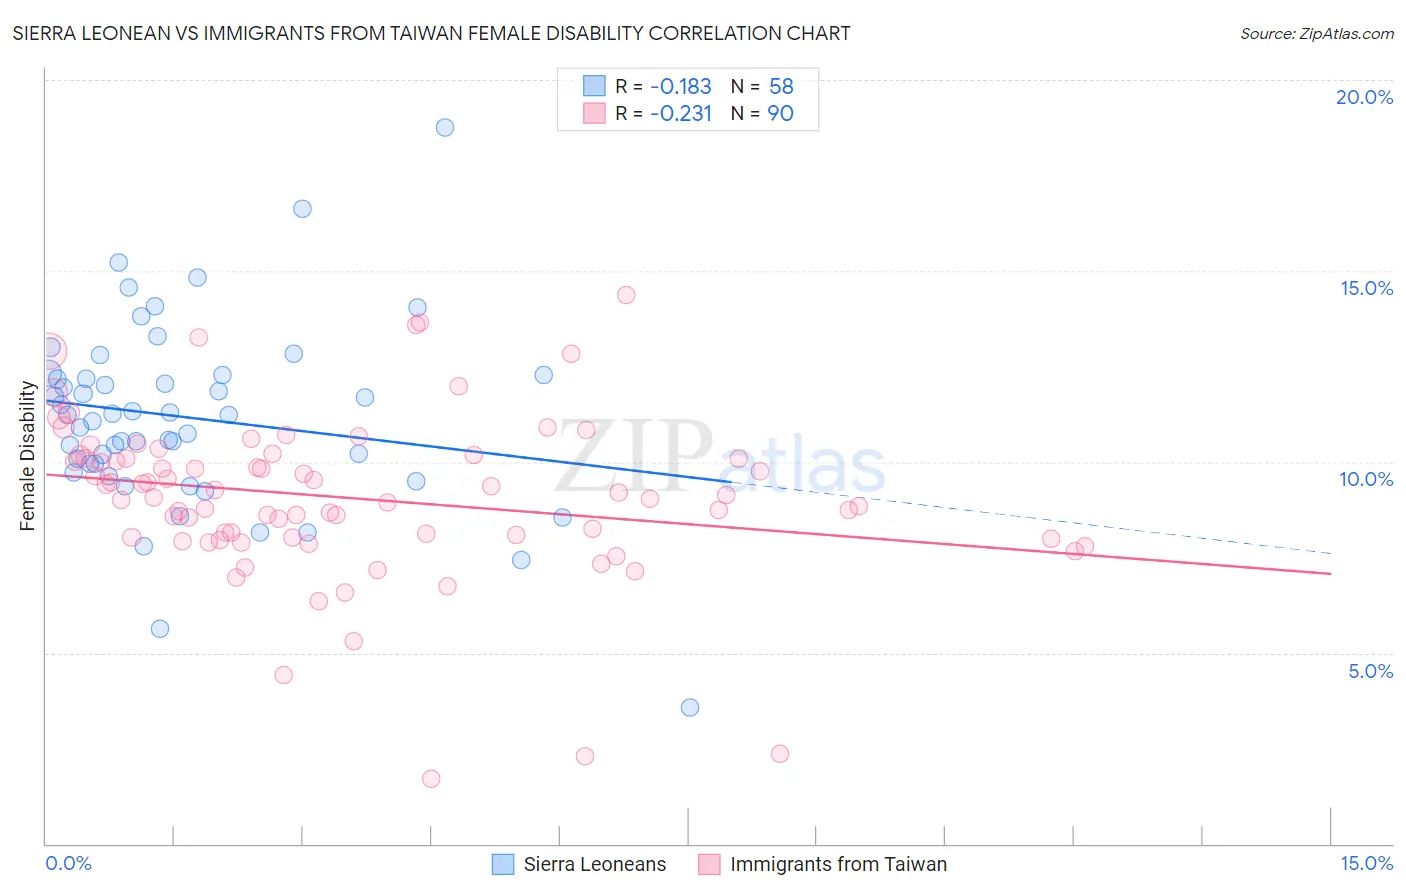
Sierra Leonean vs Immigrants from Taiwan Female Disability Correlation Chart

The statistical analysis conducted on geographies consisting of 83,353,853 people shows a poor negative correlation between the proportion of Sierra Leoneans and percentage of females with a disability in the United States with a correlation coefficient (R) of -0.183 and weighted average of 11.5%. Similarly, the statistical analysis conducted on geographies consisting of 298,238,185 people shows a weak negative correlation between the proportion of Immigrants from Taiwan and percentage of females with a disability in the United States with a correlation coefficient (R) of -0.231 and weighted average of 10.1%, a difference of 14.2%.
Sierra Leonean vs Immigrants from Taiwan Female Disability

Female Disability Correlation Summary

MeasurementSierra LeoneanImmigrants from Taiwan
Minimum3.6%1.7%
Maximum18.8%14.4%
Range15.2%12.7%
Mean11.2%9.1%
Median11.2%9.1%
Interquartile 25% (IQ1)9.9%8.0%
Interquartile 75% (IQ3)12.3%10.1%
Interquartile Range (IQR)2.3%2.1%
Standard Deviation (Sample)2.5%2.2%
Standard Deviation (Population)2.4%2.2%

Similar Demographics by Female Disability

Demographics Similar to Sierra Leoneans by Female Disability

In terms of female disability, the demographic groups most similar to Sierra Leoneans are Immigrants from Jordan (11.5%, a difference of 0.010%), Immigrants from South Africa (11.5%, a difference of 0.020%), Immigrants from Eritrea (11.5%, a difference of 0.030%), Immigrants from Afghanistan (11.5%, a difference of 0.030%), and Immigrants from Lebanon (11.5%, a difference of 0.060%).
DemographicsRating | RankFemale Disability
Chileans
99.8
/100
|
#72
Exceptional
11.5%
Immigrants | Switzerland
99.8
/100
|
#73
Exceptional
11.5%
Bhutanese
99.8
/100
|
#74
Exceptional
11.5%
Immigrants | Lebanon
99.7
/100
|
#75
Exceptional
11.5%
Immigrants | Eritrea
99.7
/100
|
#76
Exceptional
11.5%
Immigrants | Afghanistan
99.7
/100
|
#77
Exceptional
11.5%
Immigrants | South Africa
99.7
/100
|
#78
Exceptional
11.5%
Sierra Leoneans
99.7
/100
|
#79
Exceptional
11.5%
Immigrants | Jordan
99.7
/100
|
#80
Exceptional
11.5%
Eastern Europeans
99.7
/100
|
#81
Exceptional
11.5%
Luxembourgers
99.6
/100
|
#82
Exceptional
11.6%
Immigrants | Serbia
99.6
/100
|
#83
Exceptional
11.6%
Immigrants | Poland
99.6
/100
|
#84
Exceptional
11.6%
Palestinians
99.6
/100
|
#85
Exceptional
11.6%
Immigrants | Cameroon
99.6
/100
|
#86
Exceptional
11.6%

Demographics Similar to Immigrants from Taiwan by Female Disability

In terms of female disability, the demographic groups most similar to Immigrants from Taiwan are Filipino (10.1%, a difference of 0.23%), Thai (10.2%, a difference of 0.88%), Immigrants from India (10.0%, a difference of 1.2%), Immigrants from Bolivia (10.3%, a difference of 1.7%), and Bolivian (10.4%, a difference of 2.6%).
DemographicsRating | RankFemale Disability
Immigrants | India
100.0
/100
|
#1
Exceptional
10.0%
Filipinos
100.0
/100
|
#2
Exceptional
10.1%
Immigrants | Taiwan
100.0
/100
|
#3
Exceptional
10.1%
Thais
100.0
/100
|
#4
Exceptional
10.2%
Immigrants | Bolivia
100.0
/100
|
#5
Exceptional
10.3%
Bolivians
100.0
/100
|
#6
Exceptional
10.4%
Immigrants | Singapore
100.0
/100
|
#7
Exceptional
10.4%
Immigrants | South Central Asia
100.0
/100
|
#8
Exceptional
10.5%
Iranians
100.0
/100
|
#9
Exceptional
10.6%
Immigrants | Hong Kong
100.0
/100
|
#10
Exceptional
10.6%
Immigrants | Korea
100.0
/100
|
#11
Exceptional
10.6%
Immigrants | Israel
100.0
/100
|
#12
Exceptional
10.7%
Immigrants | Eastern Asia
100.0
/100
|
#13
Exceptional
10.7%
Immigrants | China
100.0
/100
|
#14
Exceptional
10.7%
Burmese
100.0
/100
|
#15
Exceptional
10.7%