Serbian vs Turkish Vision Disability
COMPARE
Serbian
Turkish
Vision Disability
Vision Disability Comparison
Serbians
Turks
2.1%
VISION DISABILITY
70.2/ 100
METRIC RATING
157th/ 347
METRIC RANK
1.9%
VISION DISABILITY
100.0/ 100
METRIC RATING
21st/ 347
METRIC RANK
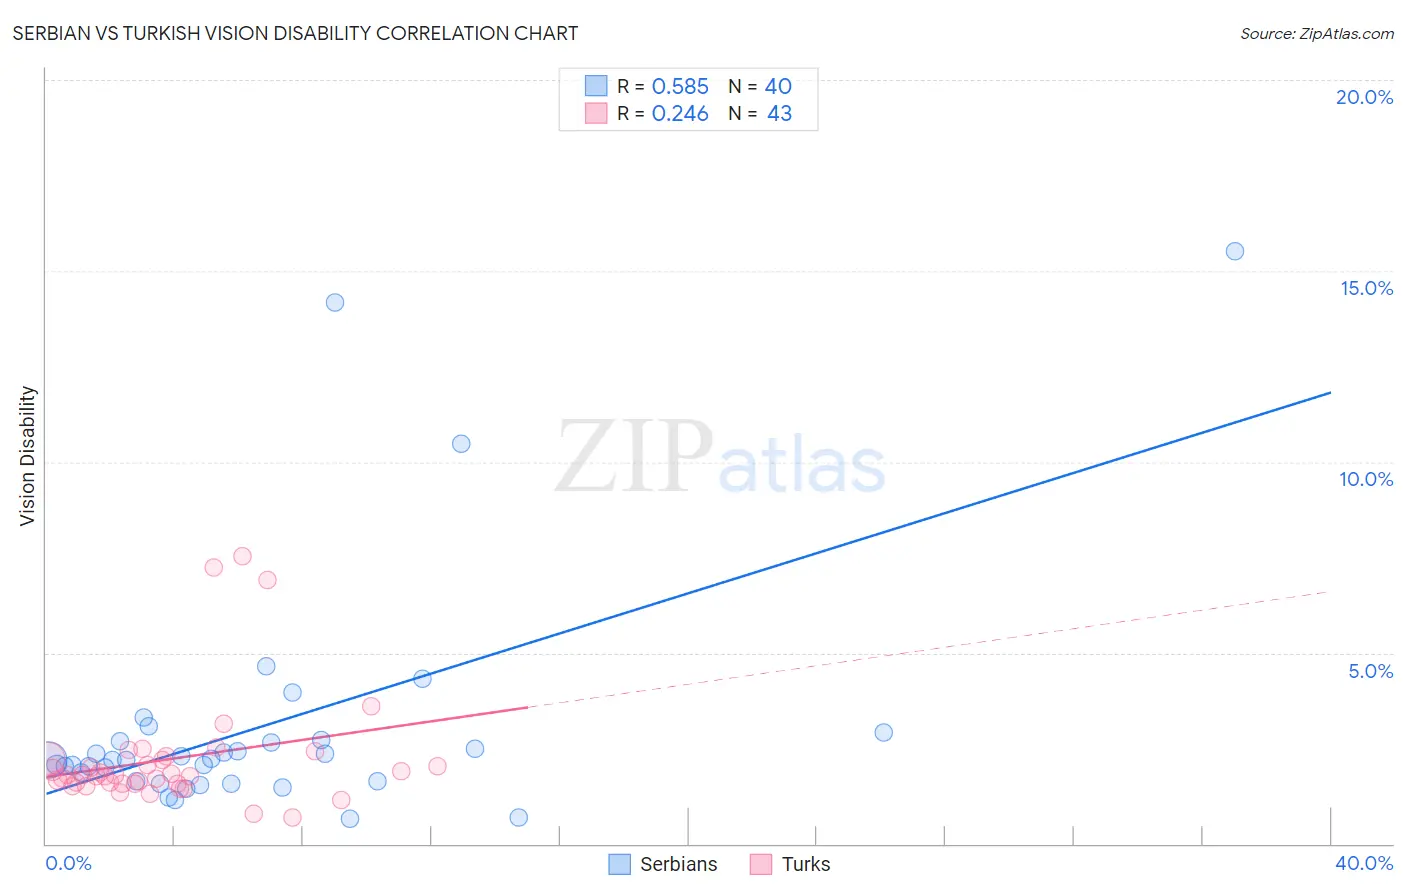
Serbian vs Turkish Vision Disability Correlation Chart
The statistical analysis conducted on geographies consisting of 267,561,592 people shows a substantial positive correlation between the proportion of Serbians and percentage of population with vision disability in the United States with a correlation coefficient (R) of 0.585 and weighted average of 2.1%. Similarly, the statistical analysis conducted on geographies consisting of 271,748,480 people shows a weak positive correlation between the proportion of Turks and percentage of population with vision disability in the United States with a correlation coefficient (R) of 0.246 and weighted average of 1.9%, a difference of 12.1%.
Vision Disability Correlation Summary
| Measurement | Serbian | Turkish |
| Minimum | 0.66% | 0.70% |
| Maximum | 15.5% | 7.5% |
| Range | 14.8% | 6.8% |
| Mean | 3.1% | 2.2% |
| Median | 2.2% | 1.8% |
| Interquartile 25% (IQ1) | 1.6% | 1.6% |
| Interquartile 75% (IQ3) | 2.7% | 2.2% |
| Interquartile Range (IQR) | 1.1% | 0.65% |
| Standard Deviation (Sample) | 3.1% | 1.5% |
| Standard Deviation (Population) | 3.1% | 1.5% |
Similar Demographics by Vision Disability
Demographics Similar to Serbians by Vision Disability
In terms of vision disability, the demographic groups most similar to Serbians are Immigrants from Uzbekistan (2.1%, a difference of 0.030%), South African (2.1%, a difference of 0.030%), Austrian (2.1%, a difference of 0.090%), Pakistani (2.1%, a difference of 0.11%), and Immigrants from Colombia (2.1%, a difference of 0.14%).
| Demographics | Rating | Rank | Vision Disability |
| Belgians | 75.9 /100 | #150 | Good 2.1% |
| Immigrants | Norway | 75.5 /100 | #151 | Good 2.1% |
| Immigrants | Southern Europe | 74.6 /100 | #152 | Good 2.1% |
| Immigrants | South America | 73.8 /100 | #153 | Good 2.1% |
| Slovenes | 73.6 /100 | #154 | Good 2.1% |
| Immigrants | Colombia | 72.1 /100 | #155 | Good 2.1% |
| Pakistanis | 71.6 /100 | #156 | Good 2.1% |
| Serbians | 70.2 /100 | #157 | Good 2.1% |
| Immigrants | Uzbekistan | 69.9 /100 | #158 | Good 2.1% |
| South Africans | 69.8 /100 | #159 | Good 2.1% |
| Austrians | 69.0 /100 | #160 | Good 2.1% |
| Iraqis | 67.7 /100 | #161 | Good 2.1% |
| Hungarians | 67.4 /100 | #162 | Good 2.1% |
| Icelanders | 66.1 /100 | #163 | Good 2.1% |
| Immigrants | Bangladesh | 65.5 /100 | #164 | Good 2.1% |
Demographics Similar to Turks by Vision Disability
In terms of vision disability, the demographic groups most similar to Turks are Immigrants from Pakistan (1.9%, a difference of 0.050%), Asian (1.9%, a difference of 0.31%), Immigrants from Asia (1.9%, a difference of 0.59%), Immigrants from Lithuania (1.9%, a difference of 0.71%), and Bulgarian (1.9%, a difference of 0.75%).
| Demographics | Rating | Rank | Vision Disability |
| Immigrants | China | 100.0 /100 | #14 | Exceptional 1.8% |
| Immigrants | Bolivia | 100.0 /100 | #15 | Exceptional 1.8% |
| Indians (Asian) | 100.0 /100 | #16 | Exceptional 1.8% |
| Burmese | 100.0 /100 | #17 | Exceptional 1.8% |
| Bolivians | 100.0 /100 | #18 | Exceptional 1.9% |
| Immigrants | Sri Lanka | 100.0 /100 | #19 | Exceptional 1.9% |
| Asians | 100.0 /100 | #20 | Exceptional 1.9% |
| Turks | 100.0 /100 | #21 | Exceptional 1.9% |
| Immigrants | Pakistan | 100.0 /100 | #22 | Exceptional 1.9% |
| Immigrants | Asia | 99.9 /100 | #23 | Exceptional 1.9% |
| Immigrants | Lithuania | 99.9 /100 | #24 | Exceptional 1.9% |
| Bulgarians | 99.9 /100 | #25 | Exceptional 1.9% |
| Immigrants | Japan | 99.9 /100 | #26 | Exceptional 1.9% |
| Taiwanese | 99.9 /100 | #27 | Exceptional 1.9% |
| Immigrants | Malaysia | 99.9 /100 | #28 | Exceptional 1.9% |