Scottish vs Spanish American Disability
COMPARE
Scottish
Spanish American
Disability
Disability Comparison
Scottish
Spanish Americans
12.9%
DISABILITY
0.0/ 100
METRIC RATING
282nd/ 347
METRIC RANK
13.6%
DISABILITY
0.0/ 100
METRIC RATING
312th/ 347
METRIC RANK
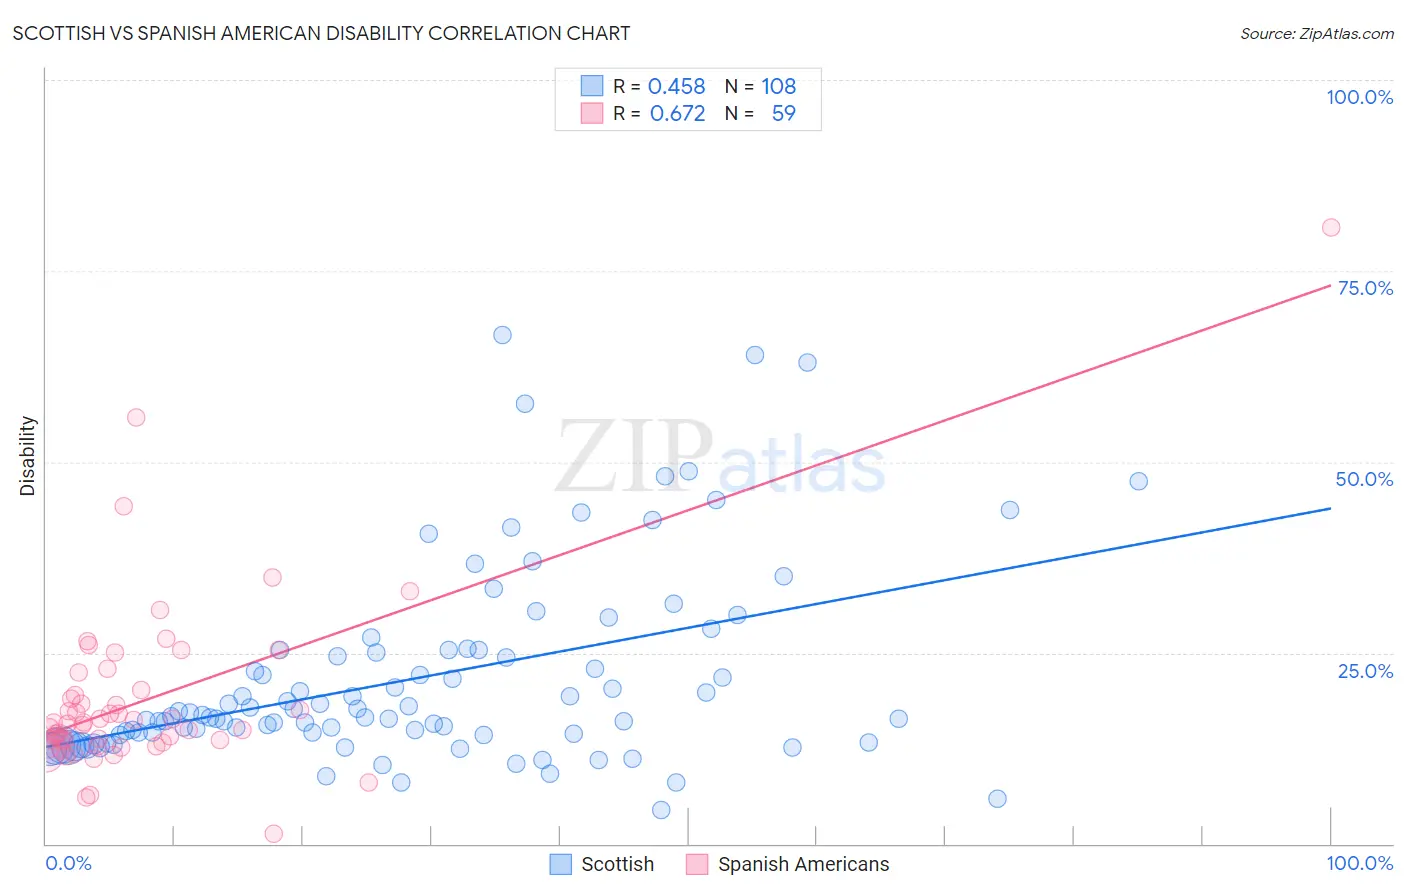
Scottish vs Spanish American Disability Correlation Chart
The statistical analysis conducted on geographies consisting of 567,015,833 people shows a moderate positive correlation between the proportion of Scottish and percentage of population with a disability in the United States with a correlation coefficient (R) of 0.458 and weighted average of 12.9%. Similarly, the statistical analysis conducted on geographies consisting of 103,168,597 people shows a significant positive correlation between the proportion of Spanish Americans and percentage of population with a disability in the United States with a correlation coefficient (R) of 0.672 and weighted average of 13.6%, a difference of 6.0%.
Disability Correlation Summary
| Measurement | Scottish | Spanish American |
| Minimum | 4.3% | 1.3% |
| Maximum | 66.7% | 80.7% |
| Range | 62.3% | 79.5% |
| Mean | 21.6% | 18.8% |
| Median | 16.7% | 15.7% |
| Interquartile 25% (IQ1) | 14.2% | 13.3% |
| Interquartile 75% (IQ3) | 25.2% | 20.1% |
| Interquartile Range (IQR) | 11.0% | 6.8% |
| Standard Deviation (Sample) | 12.7% | 12.0% |
| Standard Deviation (Population) | 12.6% | 11.9% |
Similar Demographics by Disability
Demographics Similar to Scottish by Disability
In terms of disability, the demographic groups most similar to Scottish are Irish (12.9%, a difference of 0.020%), Immigrants from Portugal (12.9%, a difference of 0.14%), Welsh (12.9%, a difference of 0.22%), Crow (12.9%, a difference of 0.22%), and Spanish (12.8%, a difference of 0.28%).
| Demographics | Rating | Rank | Disability |
| Sioux | 0.0 /100 | #275 | Tragic 12.8% |
| Hmong | 0.0 /100 | #276 | Tragic 12.8% |
| Dutch | 0.0 /100 | #277 | Tragic 12.8% |
| Germans | 0.0 /100 | #278 | Tragic 12.8% |
| Fijians | 0.0 /100 | #279 | Tragic 12.8% |
| Spanish | 0.0 /100 | #280 | Tragic 12.8% |
| Immigrants | Portugal | 0.0 /100 | #281 | Tragic 12.9% |
| Scottish | 0.0 /100 | #282 | Tragic 12.9% |
| Irish | 0.0 /100 | #283 | Tragic 12.9% |
| Welsh | 0.0 /100 | #284 | Tragic 12.9% |
| Crow | 0.0 /100 | #285 | Tragic 12.9% |
| English | 0.0 /100 | #286 | Tragic 13.0% |
| Africans | 0.0 /100 | #287 | Tragic 13.0% |
| Whites/Caucasians | 0.0 /100 | #288 | Tragic 13.0% |
| Slovaks | 0.0 /100 | #289 | Tragic 13.0% |
Demographics Similar to Spanish Americans by Disability
In terms of disability, the demographic groups most similar to Spanish Americans are Delaware (13.6%, a difference of 0.24%), Blackfeet (13.6%, a difference of 0.28%), Cree (13.7%, a difference of 0.35%), Black/African American (13.7%, a difference of 0.39%), and Puget Sound Salish (13.7%, a difference of 0.39%).
| Demographics | Rating | Rank | Disability |
| French Canadians | 0.0 /100 | #305 | Tragic 13.4% |
| Cape Verdeans | 0.0 /100 | #306 | Tragic 13.5% |
| Shoshone | 0.0 /100 | #307 | Tragic 13.5% |
| French American Indians | 0.0 /100 | #308 | Tragic 13.5% |
| Tlingit-Haida | 0.0 /100 | #309 | Tragic 13.5% |
| Blackfeet | 0.0 /100 | #310 | Tragic 13.6% |
| Delaware | 0.0 /100 | #311 | Tragic 13.6% |
| Spanish Americans | 0.0 /100 | #312 | Tragic 13.6% |
| Cree | 0.0 /100 | #313 | Tragic 13.7% |
| Blacks/African Americans | 0.0 /100 | #314 | Tragic 13.7% |
| Puget Sound Salish | 0.0 /100 | #315 | Tragic 13.7% |
| Pima | 0.0 /100 | #316 | Tragic 13.7% |
| Immigrants | Cabo Verde | 0.0 /100 | #317 | Tragic 13.7% |
| Menominee | 0.0 /100 | #318 | Tragic 13.8% |
| Iroquois | 0.0 /100 | #319 | Tragic 13.8% |