Scotch-Irish vs Immigrants from China Ambulatory Disability
COMPARE
Scotch-Irish
Immigrants from China
Ambulatory Disability
Ambulatory Disability Comparison
Scotch-Irish
Immigrants from China
6.9%
AMBULATORY DISABILITY
0.0/ 100
METRIC RATING
290th/ 347
METRIC RANK
5.3%
AMBULATORY DISABILITY
100.0/ 100
METRIC RATING
15th/ 347
METRIC RANK
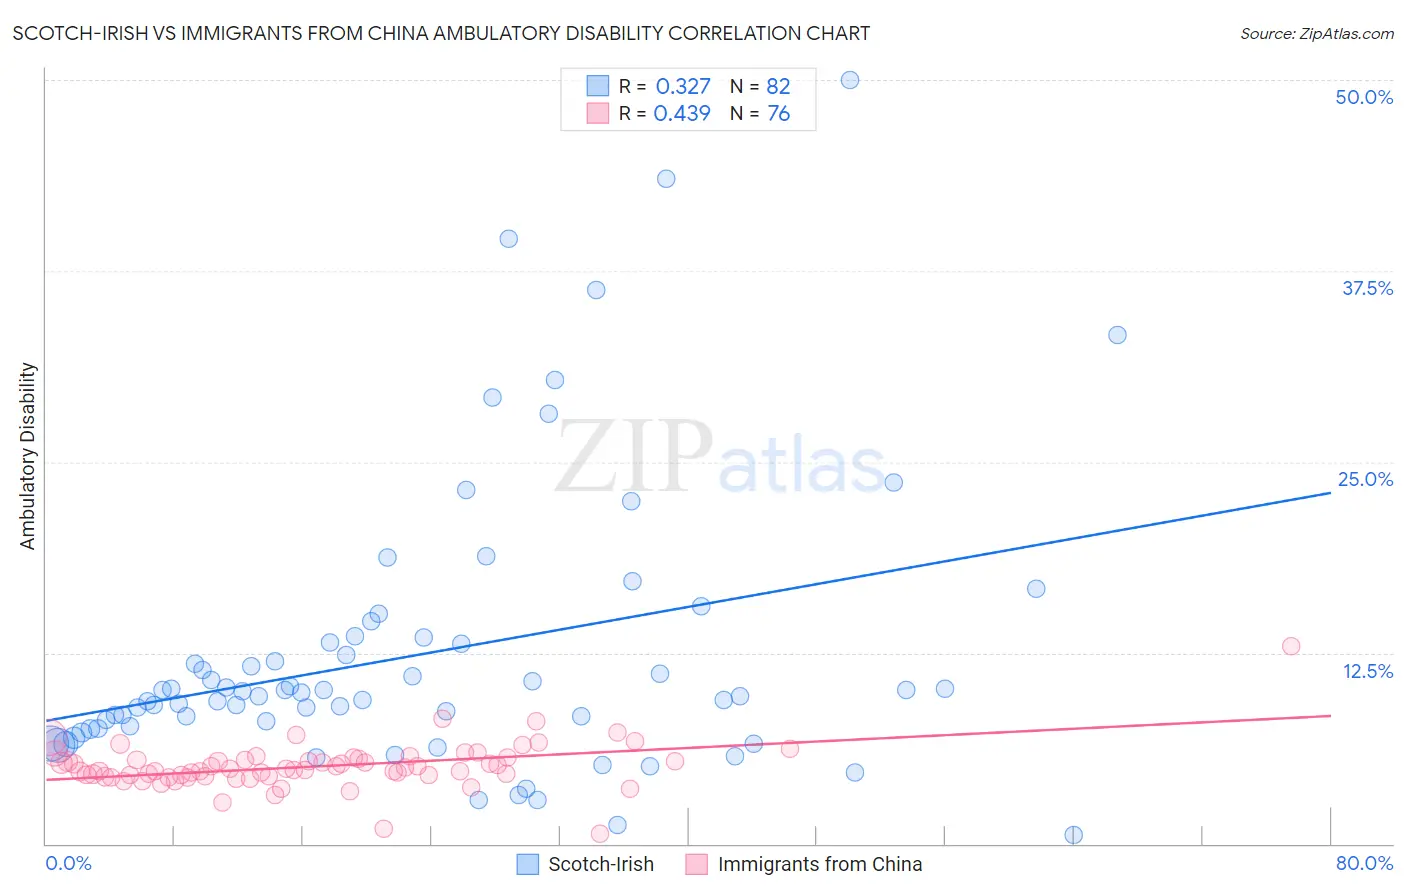
Scotch-Irish vs Immigrants from China Ambulatory Disability Correlation Chart
The statistical analysis conducted on geographies consisting of 548,439,452 people shows a mild positive correlation between the proportion of Scotch-Irish and percentage of population with ambulatory disability in the United States with a correlation coefficient (R) of 0.327 and weighted average of 6.9%. Similarly, the statistical analysis conducted on geographies consisting of 456,848,702 people shows a moderate positive correlation between the proportion of Immigrants from China and percentage of population with ambulatory disability in the United States with a correlation coefficient (R) of 0.439 and weighted average of 5.3%, a difference of 29.3%.
Ambulatory Disability Correlation Summary
| Measurement | Scotch-Irish | Immigrants from China |
| Minimum | 0.57% | 0.61% |
| Maximum | 50.0% | 12.9% |
| Range | 49.4% | 12.3% |
| Mean | 12.4% | 5.1% |
| Median | 9.8% | 4.8% |
| Interquartile 25% (IQ1) | 7.5% | 4.4% |
| Interquartile 75% (IQ3) | 13.2% | 5.5% |
| Interquartile Range (IQR) | 5.6% | 1.1% |
| Standard Deviation (Sample) | 9.3% | 1.5% |
| Standard Deviation (Population) | 9.2% | 1.5% |
Similar Demographics by Ambulatory Disability
Demographics Similar to Scotch-Irish by Ambulatory Disability
In terms of ambulatory disability, the demographic groups most similar to Scotch-Irish are Immigrants from Dominica (6.9%, a difference of 0.030%), West Indian (6.9%, a difference of 0.10%), Cheyenne (6.9%, a difference of 0.16%), Nonimmigrants (6.9%, a difference of 0.17%), and Immigrants from St. Vincent and the Grenadines (6.9%, a difference of 0.40%).
| Demographics | Rating | Rank | Ambulatory Disability |
| Immigrants | Barbados | 0.0 /100 | #283 | Tragic 6.8% |
| Immigrants | Jamaica | 0.0 /100 | #284 | Tragic 6.8% |
| Fijians | 0.0 /100 | #285 | Tragic 6.8% |
| Yakama | 0.0 /100 | #286 | Tragic 6.8% |
| U.S. Virgin Islanders | 0.0 /100 | #287 | Tragic 6.8% |
| Immigrants | Nonimmigrants | 0.0 /100 | #288 | Tragic 6.9% |
| Immigrants | Dominica | 0.0 /100 | #289 | Tragic 6.9% |
| Scotch-Irish | 0.0 /100 | #290 | Tragic 6.9% |
| West Indians | 0.0 /100 | #291 | Tragic 6.9% |
| Cheyenne | 0.0 /100 | #292 | Tragic 6.9% |
| Immigrants | St. Vincent and the Grenadines | 0.0 /100 | #293 | Tragic 6.9% |
| Cape Verdeans | 0.0 /100 | #294 | Tragic 6.9% |
| Crow | 0.0 /100 | #295 | Tragic 6.9% |
| Alaskan Athabascans | 0.0 /100 | #296 | Tragic 6.9% |
| French American Indians | 0.0 /100 | #297 | Tragic 6.9% |
Demographics Similar to Immigrants from China by Ambulatory Disability
In terms of ambulatory disability, the demographic groups most similar to Immigrants from China are Immigrants from Eastern Asia (5.3%, a difference of 0.33%), Burmese (5.3%, a difference of 0.48%), Immigrants from Hong Kong (5.3%, a difference of 0.54%), Immigrants from Ethiopia (5.4%, a difference of 0.88%), and Immigrants from Sri Lanka (5.4%, a difference of 0.88%).
| Demographics | Rating | Rank | Ambulatory Disability |
| Immigrants | South Central Asia | 100.0 /100 | #8 | Exceptional 5.1% |
| Iranians | 100.0 /100 | #9 | Exceptional 5.1% |
| Yup'ik | 100.0 /100 | #10 | Exceptional 5.2% |
| Immigrants | Korea | 100.0 /100 | #11 | Exceptional 5.2% |
| Okinawans | 100.0 /100 | #12 | Exceptional 5.3% |
| Burmese | 100.0 /100 | #13 | Exceptional 5.3% |
| Immigrants | Eastern Asia | 100.0 /100 | #14 | Exceptional 5.3% |
| Immigrants | China | 100.0 /100 | #15 | Exceptional 5.3% |
| Immigrants | Hong Kong | 100.0 /100 | #16 | Exceptional 5.3% |
| Immigrants | Ethiopia | 100.0 /100 | #17 | Exceptional 5.4% |
| Immigrants | Sri Lanka | 100.0 /100 | #18 | Exceptional 5.4% |
| Indians (Asian) | 100.0 /100 | #19 | Exceptional 5.4% |
| Ethiopians | 100.0 /100 | #20 | Exceptional 5.4% |
| Immigrants | Kuwait | 100.0 /100 | #21 | Exceptional 5.4% |
| Immigrants | Israel | 100.0 /100 | #22 | Exceptional 5.4% |