Samoan vs Immigrants from Spain Disability Age 65 to 74
COMPARE
Samoan
Immigrants from Spain
Disability Age 65 to 74
Disability Age 65 to 74 Comparison
Samoans
Immigrants from Spain
25.4%
DISABILITY AGE 65 TO 74
0.2/ 100
METRIC RATING
262nd/ 347
METRIC RANK
21.9%
DISABILITY AGE 65 TO 74
98.5/ 100
METRIC RATING
84th/ 347
METRIC RANK
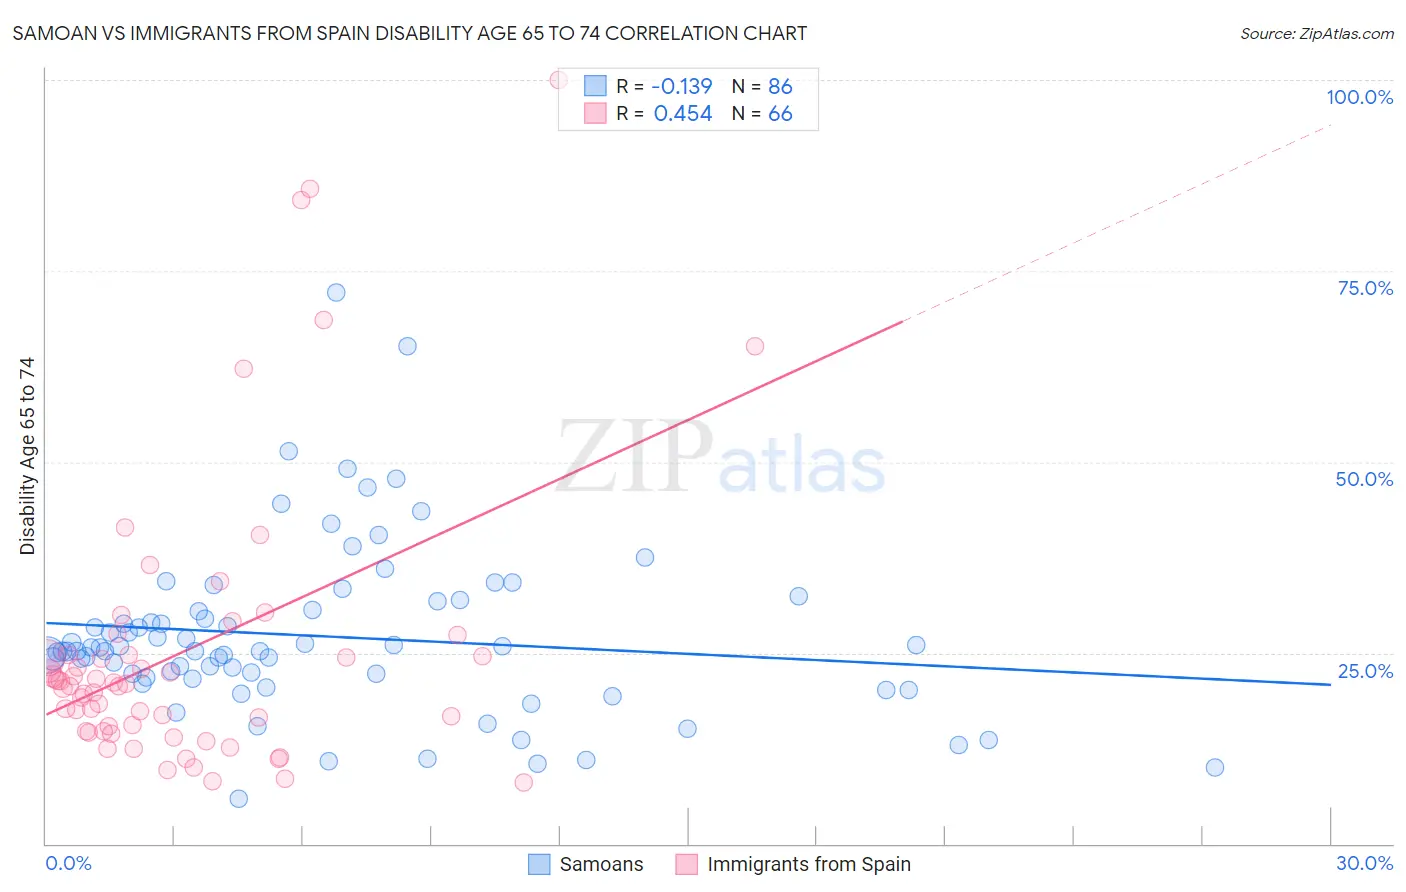
Samoan vs Immigrants from Spain Disability Age 65 to 74 Correlation Chart
The statistical analysis conducted on geographies consisting of 224,691,566 people shows a poor negative correlation between the proportion of Samoans and percentage of population with a disability between the ages 65 and 75 in the United States with a correlation coefficient (R) of -0.139 and weighted average of 25.4%. Similarly, the statistical analysis conducted on geographies consisting of 239,411,808 people shows a moderate positive correlation between the proportion of Immigrants from Spain and percentage of population with a disability between the ages 65 and 75 in the United States with a correlation coefficient (R) of 0.454 and weighted average of 21.9%, a difference of 16.1%.
Disability Age 65 to 74 Correlation Summary
| Measurement | Samoan | Immigrants from Spain |
| Minimum | 5.9% | 8.0% |
| Maximum | 72.2% | 100.0% |
| Range | 66.4% | 92.0% |
| Mean | 27.2% | 25.2% |
| Median | 25.3% | 20.8% |
| Interquartile 25% (IQ1) | 21.8% | 14.7% |
| Interquartile 75% (IQ3) | 30.7% | 24.7% |
| Interquartile Range (IQR) | 8.9% | 10.0% |
| Standard Deviation (Sample) | 11.1% | 18.6% |
| Standard Deviation (Population) | 11.1% | 18.5% |
Similar Demographics by Disability Age 65 to 74
Demographics Similar to Samoans by Disability Age 65 to 74
In terms of disability age 65 to 74, the demographic groups most similar to Samoans are Iroquois (25.4%, a difference of 0.010%), Cape Verdean (25.4%, a difference of 0.10%), Malaysian (25.4%, a difference of 0.18%), Hawaiian (25.5%, a difference of 0.35%), and Guatemalan (25.5%, a difference of 0.40%).
| Demographics | Rating | Rank | Disability Age 65 to 74 |
| Central Americans | 0.5 /100 | #255 | Tragic 25.1% |
| Immigrants | Somalia | 0.4 /100 | #256 | Tragic 25.2% |
| Guamanians/Chamorros | 0.3 /100 | #257 | Tragic 25.3% |
| Marshallese | 0.3 /100 | #258 | Tragic 25.3% |
| Immigrants | Cambodia | 0.3 /100 | #259 | Tragic 25.3% |
| Malaysians | 0.2 /100 | #260 | Tragic 25.4% |
| Cape Verdeans | 0.2 /100 | #261 | Tragic 25.4% |
| Samoans | 0.2 /100 | #262 | Tragic 25.4% |
| Iroquois | 0.2 /100 | #263 | Tragic 25.4% |
| Hawaiians | 0.2 /100 | #264 | Tragic 25.5% |
| Guatemalans | 0.2 /100 | #265 | Tragic 25.5% |
| Immigrants | Latin America | 0.1 /100 | #266 | Tragic 25.6% |
| Ottawa | 0.1 /100 | #267 | Tragic 25.6% |
| Liberians | 0.1 /100 | #268 | Tragic 25.6% |
| Hmong | 0.1 /100 | #269 | Tragic 25.7% |
Demographics Similar to Immigrants from Spain by Disability Age 65 to 74
In terms of disability age 65 to 74, the demographic groups most similar to Immigrants from Spain are Immigrants from Brazil (21.9%, a difference of 0.020%), Immigrants from Lebanon (21.9%, a difference of 0.10%), South African (21.9%, a difference of 0.18%), Immigrants from Indonesia (21.9%, a difference of 0.19%), and Croatian (21.8%, a difference of 0.45%).
| Demographics | Rating | Rank | Disability Age 65 to 74 |
| Immigrants | Poland | 99.0 /100 | #77 | Exceptional 21.8% |
| Immigrants | Eastern Europe | 99.0 /100 | #78 | Exceptional 21.8% |
| Venezuelans | 99.0 /100 | #79 | Exceptional 21.8% |
| Immigrants | Norway | 98.9 /100 | #80 | Exceptional 21.8% |
| Croatians | 98.9 /100 | #81 | Exceptional 21.8% |
| Immigrants | Indonesia | 98.7 /100 | #82 | Exceptional 21.9% |
| Immigrants | Brazil | 98.5 /100 | #83 | Exceptional 21.9% |
| Immigrants | Spain | 98.5 /100 | #84 | Exceptional 21.9% |
| Immigrants | Lebanon | 98.4 /100 | #85 | Exceptional 21.9% |
| South Africans | 98.4 /100 | #86 | Exceptional 21.9% |
| Australians | 98.0 /100 | #87 | Exceptional 22.0% |
| Immigrants | Netherlands | 97.9 /100 | #88 | Exceptional 22.0% |
| Immigrants | Kuwait | 97.9 /100 | #89 | Exceptional 22.0% |
| Italians | 97.9 /100 | #90 | Exceptional 22.0% |
| Chileans | 97.9 /100 | #91 | Exceptional 22.0% |