Kiowa vs Immigrants from Spain Disability Age 65 to 74
COMPARE
Kiowa
Immigrants from Spain
Disability Age 65 to 74
Disability Age 65 to 74 Comparison
Kiowa
Immigrants from Spain
32.6%
DISABILITY AGE 65 TO 74
0.0/ 100
METRIC RATING
339th/ 347
METRIC RANK
21.9%
DISABILITY AGE 65 TO 74
98.5/ 100
METRIC RATING
84th/ 347
METRIC RANK
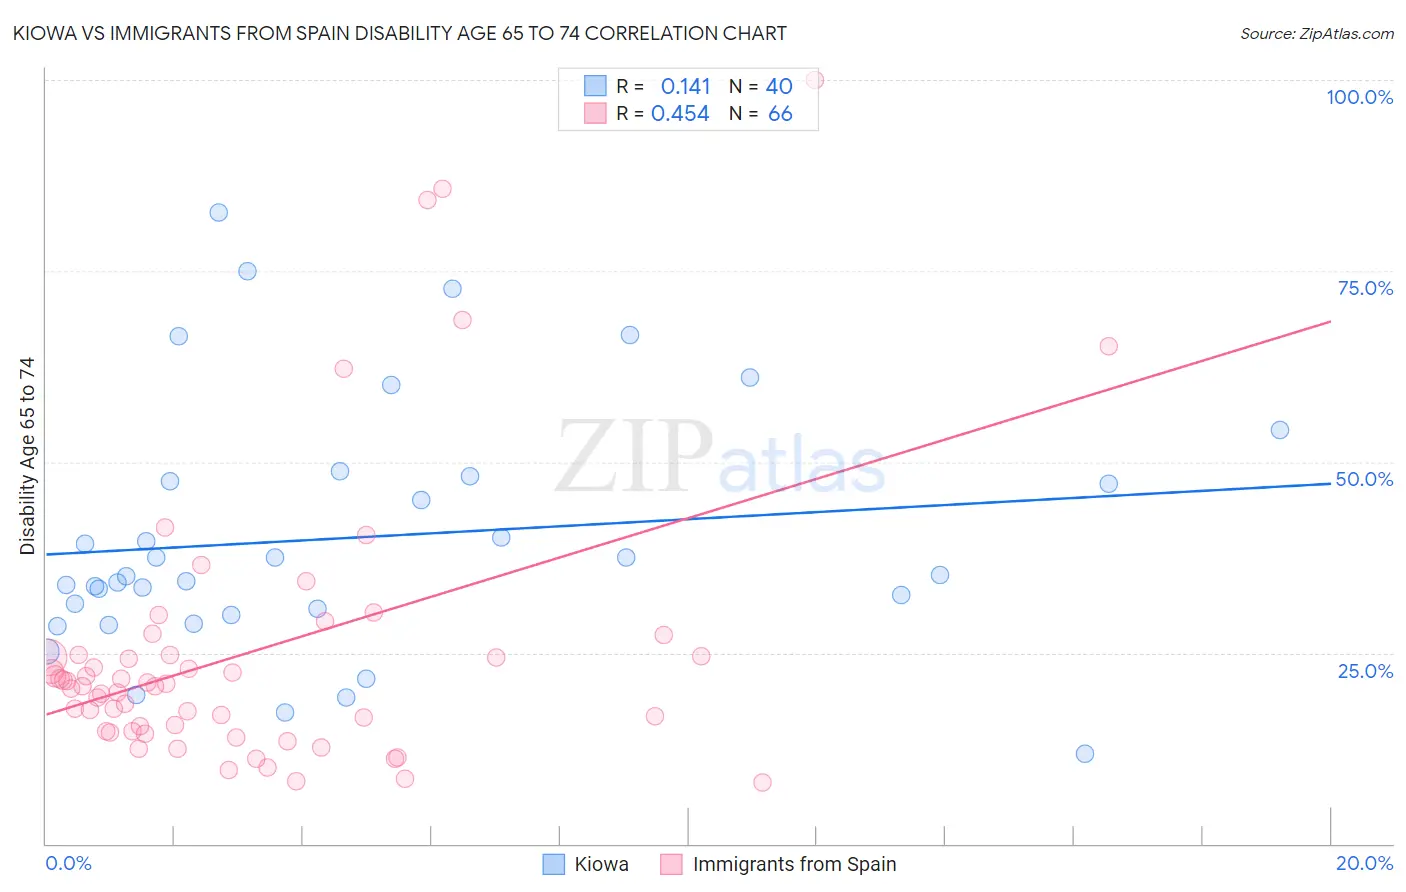
Kiowa vs Immigrants from Spain Disability Age 65 to 74 Correlation Chart
The statistical analysis conducted on geographies consisting of 56,067,785 people shows a poor positive correlation between the proportion of Kiowa and percentage of population with a disability between the ages 65 and 75 in the United States with a correlation coefficient (R) of 0.141 and weighted average of 32.6%. Similarly, the statistical analysis conducted on geographies consisting of 239,411,808 people shows a moderate positive correlation between the proportion of Immigrants from Spain and percentage of population with a disability between the ages 65 and 75 in the United States with a correlation coefficient (R) of 0.454 and weighted average of 21.9%, a difference of 48.6%.
Disability Age 65 to 74 Correlation Summary
| Measurement | Kiowa | Immigrants from Spain |
| Minimum | 11.7% | 8.0% |
| Maximum | 82.6% | 100.0% |
| Range | 70.9% | 92.0% |
| Mean | 40.1% | 25.2% |
| Median | 35.1% | 20.8% |
| Interquartile 25% (IQ1) | 30.3% | 14.7% |
| Interquartile 75% (IQ3) | 47.7% | 24.7% |
| Interquartile Range (IQR) | 17.4% | 10.0% |
| Standard Deviation (Sample) | 16.5% | 18.6% |
| Standard Deviation (Population) | 16.3% | 18.5% |
Similar Demographics by Disability Age 65 to 74
Demographics Similar to Kiowa by Disability Age 65 to 74
In terms of disability age 65 to 74, the demographic groups most similar to Kiowa are Lumbee (32.7%, a difference of 0.52%), Alaskan Athabascan (32.4%, a difference of 0.62%), Houma (32.3%, a difference of 0.81%), Tsimshian (32.9%, a difference of 1.1%), and Pueblo (33.1%, a difference of 1.7%).
| Demographics | Rating | Rank | Disability Age 65 to 74 |
| Natives/Alaskans | 0.0 /100 | #332 | Tragic 30.4% |
| Colville | 0.0 /100 | #333 | Tragic 30.5% |
| Alaska Natives | 0.0 /100 | #334 | Tragic 30.6% |
| Cheyenne | 0.0 /100 | #335 | Tragic 31.1% |
| Yuman | 0.0 /100 | #336 | Tragic 31.5% |
| Houma | 0.0 /100 | #337 | Tragic 32.3% |
| Alaskan Athabascans | 0.0 /100 | #338 | Tragic 32.4% |
| Kiowa | 0.0 /100 | #339 | Tragic 32.6% |
| Lumbee | 0.0 /100 | #340 | Tragic 32.7% |
| Tsimshian | 0.0 /100 | #341 | Tragic 32.9% |
| Pueblo | 0.0 /100 | #342 | Tragic 33.1% |
| Navajo | 0.0 /100 | #343 | Tragic 33.3% |
| Inupiat | 0.0 /100 | #344 | Tragic 34.5% |
| Tohono O'odham | 0.0 /100 | #345 | Tragic 36.0% |
| Yup'ik | 0.0 /100 | #346 | Tragic 37.8% |
Demographics Similar to Immigrants from Spain by Disability Age 65 to 74
In terms of disability age 65 to 74, the demographic groups most similar to Immigrants from Spain are Immigrants from Brazil (21.9%, a difference of 0.020%), Immigrants from Lebanon (21.9%, a difference of 0.10%), South African (21.9%, a difference of 0.18%), Immigrants from Indonesia (21.9%, a difference of 0.19%), and Croatian (21.8%, a difference of 0.45%).
| Demographics | Rating | Rank | Disability Age 65 to 74 |
| Immigrants | Poland | 99.0 /100 | #77 | Exceptional 21.8% |
| Immigrants | Eastern Europe | 99.0 /100 | #78 | Exceptional 21.8% |
| Venezuelans | 99.0 /100 | #79 | Exceptional 21.8% |
| Immigrants | Norway | 98.9 /100 | #80 | Exceptional 21.8% |
| Croatians | 98.9 /100 | #81 | Exceptional 21.8% |
| Immigrants | Indonesia | 98.7 /100 | #82 | Exceptional 21.9% |
| Immigrants | Brazil | 98.5 /100 | #83 | Exceptional 21.9% |
| Immigrants | Spain | 98.5 /100 | #84 | Exceptional 21.9% |
| Immigrants | Lebanon | 98.4 /100 | #85 | Exceptional 21.9% |
| South Africans | 98.4 /100 | #86 | Exceptional 21.9% |
| Australians | 98.0 /100 | #87 | Exceptional 22.0% |
| Immigrants | Netherlands | 97.9 /100 | #88 | Exceptional 22.0% |
| Immigrants | Kuwait | 97.9 /100 | #89 | Exceptional 22.0% |
| Italians | 97.9 /100 | #90 | Exceptional 22.0% |
| Chileans | 97.9 /100 | #91 | Exceptional 22.0% |