Puerto Rican vs Immigrants from Romania Disability
COMPARE
Puerto Rican
Immigrants from Romania
Disability
Disability Comparison
Puerto Ricans
Immigrants from Romania
16.1%
DISABILITY
0.0/ 100
METRIC RATING
345th/ 347
METRIC RANK
11.2%
DISABILITY
98.5/ 100
METRIC RATING
88th/ 347
METRIC RANK
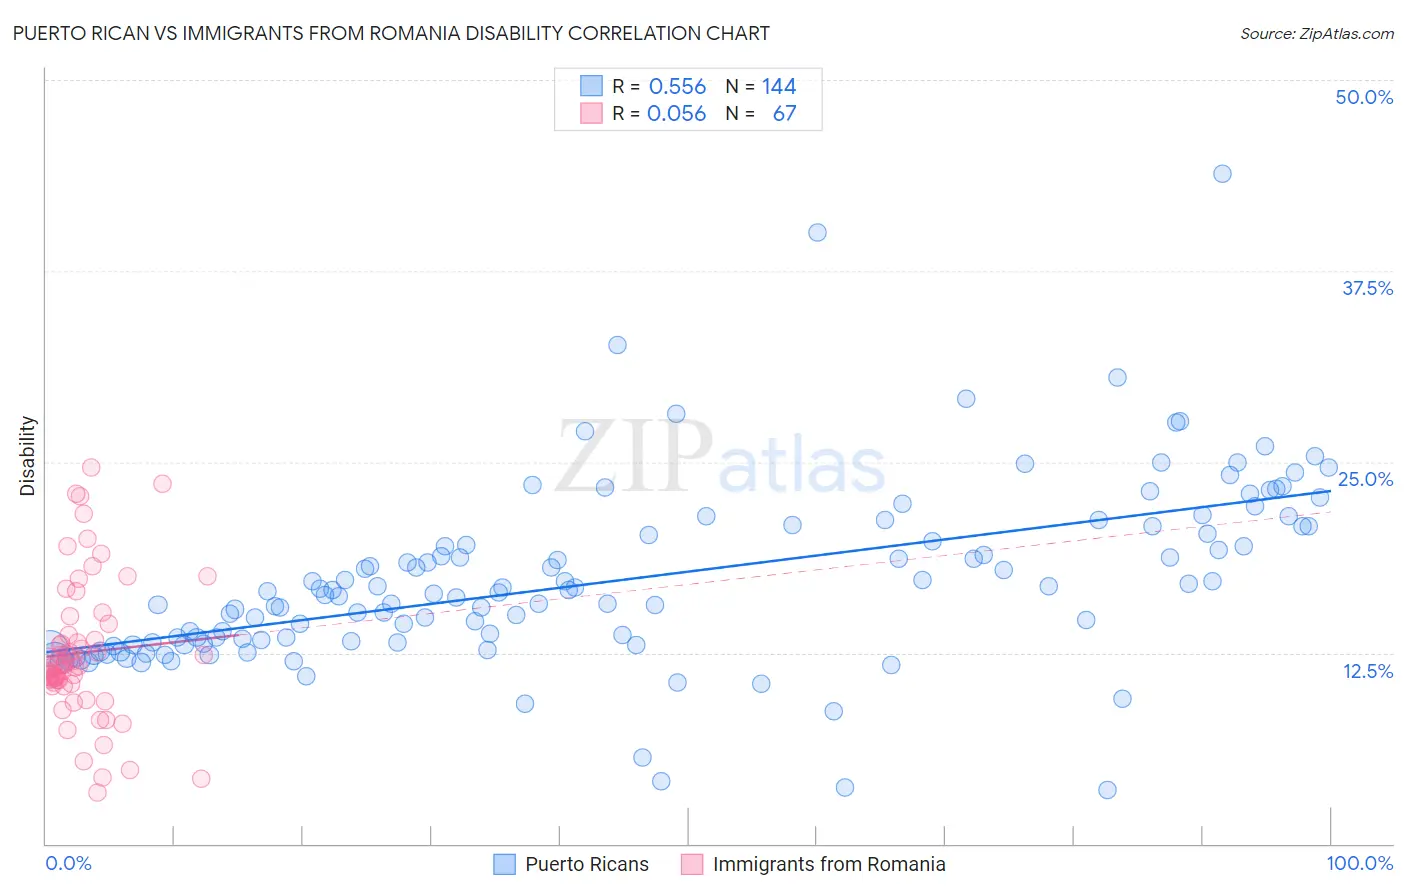
Puerto Rican vs Immigrants from Romania Disability Correlation Chart
The statistical analysis conducted on geographies consisting of 528,171,065 people shows a substantial positive correlation between the proportion of Puerto Ricans and percentage of population with a disability in the United States with a correlation coefficient (R) of 0.556 and weighted average of 16.1%. Similarly, the statistical analysis conducted on geographies consisting of 256,993,596 people shows a slight positive correlation between the proportion of Immigrants from Romania and percentage of population with a disability in the United States with a correlation coefficient (R) of 0.056 and weighted average of 11.2%, a difference of 44.4%.
Disability Correlation Summary
| Measurement | Puerto Rican | Immigrants from Romania |
| Minimum | 3.6% | 3.4% |
| Maximum | 43.9% | 24.6% |
| Range | 40.3% | 21.3% |
| Mean | 17.2% | 12.5% |
| Median | 16.4% | 11.6% |
| Interquartile 25% (IQ1) | 13.2% | 10.4% |
| Interquartile 75% (IQ3) | 20.5% | 14.4% |
| Interquartile Range (IQR) | 7.4% | 3.9% |
| Standard Deviation (Sample) | 6.0% | 4.6% |
| Standard Deviation (Population) | 6.0% | 4.6% |
Similar Demographics by Disability
Demographics Similar to Puerto Ricans by Disability
In terms of disability, the demographic groups most similar to Puerto Ricans are Tsimshian (16.1%, a difference of 0.16%), Colville (15.8%, a difference of 2.0%), Creek (15.6%, a difference of 3.3%), Kiowa (15.6%, a difference of 3.3%), and Lumbee (15.5%, a difference of 3.8%).
| Demographics | Rating | Rank | Disability |
| Cajuns | 0.0 /100 | #333 | Tragic 14.6% |
| Yuman | 0.0 /100 | #334 | Tragic 14.6% |
| Tohono O'odham | 0.0 /100 | #335 | Tragic 14.8% |
| Cherokee | 0.0 /100 | #336 | Tragic 14.8% |
| Seminole | 0.0 /100 | #337 | Tragic 14.9% |
| Dutch West Indians | 0.0 /100 | #338 | Tragic 14.9% |
| Chickasaw | 0.0 /100 | #339 | Tragic 15.2% |
| Choctaw | 0.0 /100 | #340 | Tragic 15.4% |
| Lumbee | 0.0 /100 | #341 | Tragic 15.5% |
| Kiowa | 0.0 /100 | #342 | Tragic 15.6% |
| Creek | 0.0 /100 | #343 | Tragic 15.6% |
| Colville | 0.0 /100 | #344 | Tragic 15.8% |
| Puerto Ricans | 0.0 /100 | #345 | Tragic 16.1% |
| Tsimshian | 0.0 /100 | #346 | Tragic 16.1% |
| Houma | 0.0 /100 | #347 | Tragic 17.1% |
Demographics Similar to Immigrants from Romania by Disability
In terms of disability, the demographic groups most similar to Immigrants from Romania are Immigrants from South Africa (11.2%, a difference of 0.25%), Palestinian (11.1%, a difference of 0.29%), Immigrants from Brazil (11.2%, a difference of 0.30%), Immigrants from Western Asia (11.2%, a difference of 0.32%), and Immigrants from Belarus (11.1%, a difference of 0.33%).
| Demographics | Rating | Rank | Disability |
| Immigrants | Poland | 99.1 /100 | #81 | Exceptional 11.1% |
| Chileans | 99.1 /100 | #82 | Exceptional 11.1% |
| Immigrants | Switzerland | 99.0 /100 | #83 | Exceptional 11.1% |
| Immigrants | Sierra Leone | 99.0 /100 | #84 | Exceptional 11.1% |
| Immigrants | Belarus | 98.9 /100 | #85 | Exceptional 11.1% |
| Immigrants | Russia | 98.9 /100 | #86 | Exceptional 11.1% |
| Palestinians | 98.9 /100 | #87 | Exceptional 11.1% |
| Immigrants | Romania | 98.5 /100 | #88 | Exceptional 11.2% |
| Immigrants | South Africa | 98.2 /100 | #89 | Exceptional 11.2% |
| Immigrants | Brazil | 98.1 /100 | #90 | Exceptional 11.2% |
| Immigrants | Western Asia | 98.1 /100 | #91 | Exceptional 11.2% |
| Ecuadorians | 98.0 /100 | #92 | Exceptional 11.2% |
| Immigrants | Ecuador | 98.0 /100 | #93 | Exceptional 11.2% |
| Immigrants | Morocco | 97.8 /100 | #94 | Exceptional 11.2% |
| Eastern Europeans | 97.8 /100 | #95 | Exceptional 11.2% |