Pakistani vs Immigrants from Romania Disability
COMPARE
Pakistani
Immigrants from Romania
Disability
Disability Comparison
Pakistanis
Immigrants from Romania
11.7%
DISABILITY
54.7/ 100
METRIC RATING
166th/ 347
METRIC RANK
11.2%
DISABILITY
98.5/ 100
METRIC RATING
88th/ 347
METRIC RANK
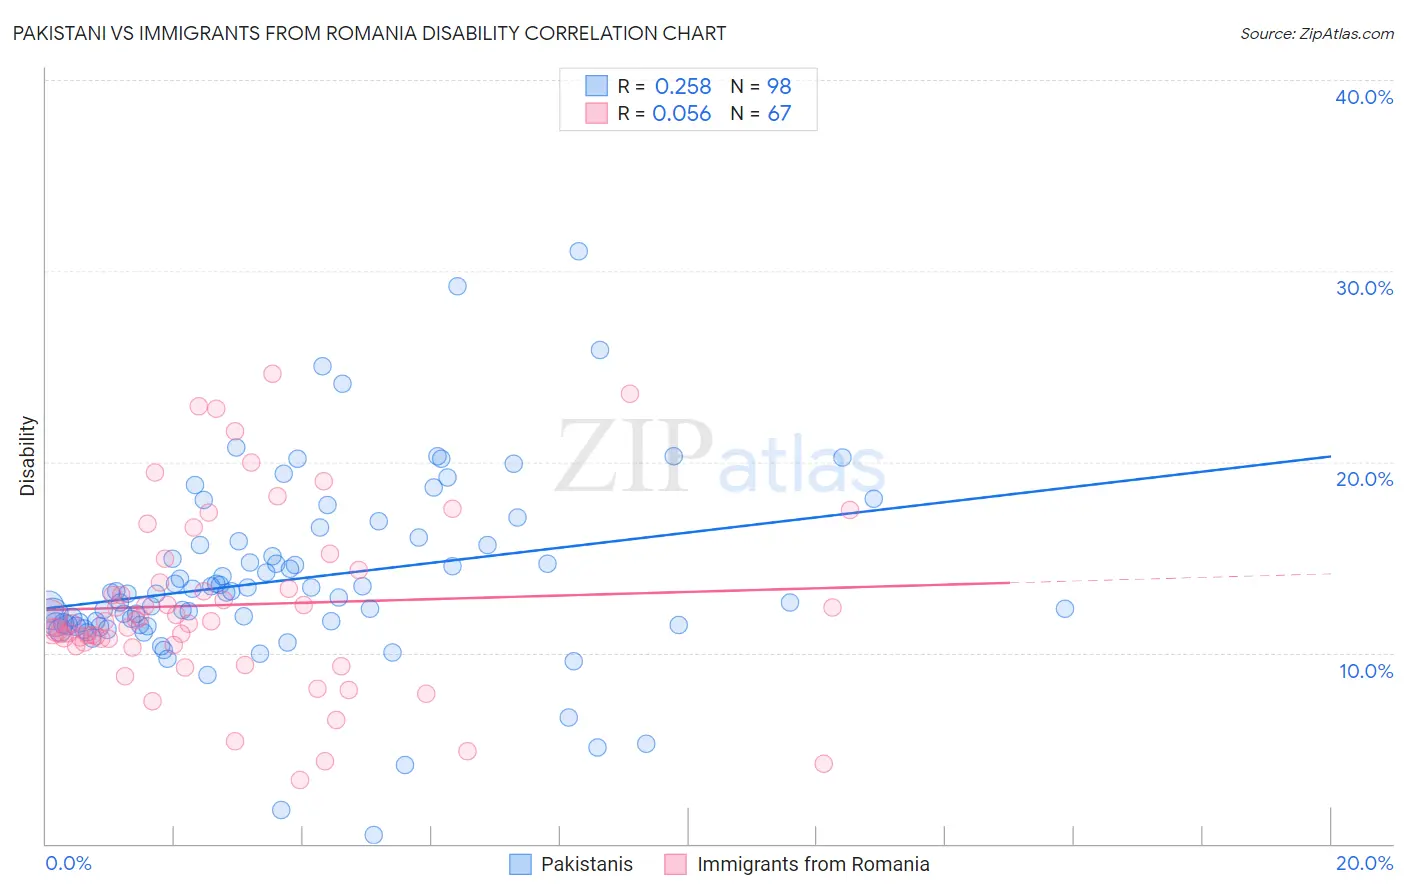
Pakistani vs Immigrants from Romania Disability Correlation Chart
The statistical analysis conducted on geographies consisting of 335,302,131 people shows a weak positive correlation between the proportion of Pakistanis and percentage of population with a disability in the United States with a correlation coefficient (R) of 0.258 and weighted average of 11.7%. Similarly, the statistical analysis conducted on geographies consisting of 256,993,596 people shows a slight positive correlation between the proportion of Immigrants from Romania and percentage of population with a disability in the United States with a correlation coefficient (R) of 0.056 and weighted average of 11.2%, a difference of 4.7%.
Disability Correlation Summary
| Measurement | Pakistani | Immigrants from Romania |
| Minimum | 0.46% | 3.4% |
| Maximum | 31.1% | 24.6% |
| Range | 30.6% | 21.3% |
| Mean | 13.9% | 12.5% |
| Median | 13.1% | 11.6% |
| Interquartile 25% (IQ1) | 11.5% | 10.4% |
| Interquartile 75% (IQ3) | 15.7% | 14.4% |
| Interquartile Range (IQR) | 4.2% | 3.9% |
| Standard Deviation (Sample) | 4.9% | 4.6% |
| Standard Deviation (Population) | 4.8% | 4.6% |
Similar Demographics by Disability
Demographics Similar to Pakistanis by Disability
In terms of disability, the demographic groups most similar to Pakistanis are Estonian (11.7%, a difference of 0.010%), Immigrants from Latin America (11.7%, a difference of 0.030%), Immigrants from Austria (11.7%, a difference of 0.060%), Immigrants from Albania (11.7%, a difference of 0.080%), and Cuban (11.7%, a difference of 0.090%).
| Demographics | Rating | Rank | Disability |
| Guatemalans | 65.1 /100 | #159 | Good 11.6% |
| Immigrants | Barbados | 64.2 /100 | #160 | Good 11.6% |
| Immigrants | Cuba | 62.8 /100 | #161 | Good 11.6% |
| Immigrants | Haiti | 59.2 /100 | #162 | Average 11.7% |
| Immigrants | Trinidad and Tobago | 58.9 /100 | #163 | Average 11.7% |
| Syrians | 58.5 /100 | #164 | Average 11.7% |
| Cubans | 56.7 /100 | #165 | Average 11.7% |
| Pakistanis | 54.7 /100 | #166 | Average 11.7% |
| Estonians | 54.4 /100 | #167 | Average 11.7% |
| Immigrants | Latin America | 54.1 /100 | #168 | Average 11.7% |
| Immigrants | Austria | 53.4 /100 | #169 | Average 11.7% |
| Immigrants | Albania | 52.8 /100 | #170 | Average 11.7% |
| Immigrants | Southern Europe | 52.8 /100 | #171 | Average 11.7% |
| Trinidadians and Tobagonians | 52.7 /100 | #172 | Average 11.7% |
| Maltese | 50.6 /100 | #173 | Average 11.7% |
Demographics Similar to Immigrants from Romania by Disability
In terms of disability, the demographic groups most similar to Immigrants from Romania are Immigrants from South Africa (11.2%, a difference of 0.25%), Palestinian (11.1%, a difference of 0.29%), Immigrants from Brazil (11.2%, a difference of 0.30%), Immigrants from Western Asia (11.2%, a difference of 0.32%), and Immigrants from Belarus (11.1%, a difference of 0.33%).
| Demographics | Rating | Rank | Disability |
| Immigrants | Poland | 99.1 /100 | #81 | Exceptional 11.1% |
| Chileans | 99.1 /100 | #82 | Exceptional 11.1% |
| Immigrants | Switzerland | 99.0 /100 | #83 | Exceptional 11.1% |
| Immigrants | Sierra Leone | 99.0 /100 | #84 | Exceptional 11.1% |
| Immigrants | Belarus | 98.9 /100 | #85 | Exceptional 11.1% |
| Immigrants | Russia | 98.9 /100 | #86 | Exceptional 11.1% |
| Palestinians | 98.9 /100 | #87 | Exceptional 11.1% |
| Immigrants | Romania | 98.5 /100 | #88 | Exceptional 11.2% |
| Immigrants | South Africa | 98.2 /100 | #89 | Exceptional 11.2% |
| Immigrants | Brazil | 98.1 /100 | #90 | Exceptional 11.2% |
| Immigrants | Western Asia | 98.1 /100 | #91 | Exceptional 11.2% |
| Ecuadorians | 98.0 /100 | #92 | Exceptional 11.2% |
| Immigrants | Ecuador | 98.0 /100 | #93 | Exceptional 11.2% |
| Immigrants | Morocco | 97.8 /100 | #94 | Exceptional 11.2% |
| Eastern Europeans | 97.8 /100 | #95 | Exceptional 11.2% |