Potawatomi vs Immigrants from Western Europe Ambulatory Disability
COMPARE
Potawatomi
Immigrants from Western Europe
Ambulatory Disability
Ambulatory Disability Comparison
Potawatomi
Immigrants from Western Europe
7.3%
AMBULATORY DISABILITY
0.0/ 100
METRIC RATING
320th/ 347
METRIC RANK
6.2%
AMBULATORY DISABILITY
31.6/ 100
METRIC RATING
192nd/ 347
METRIC RANK
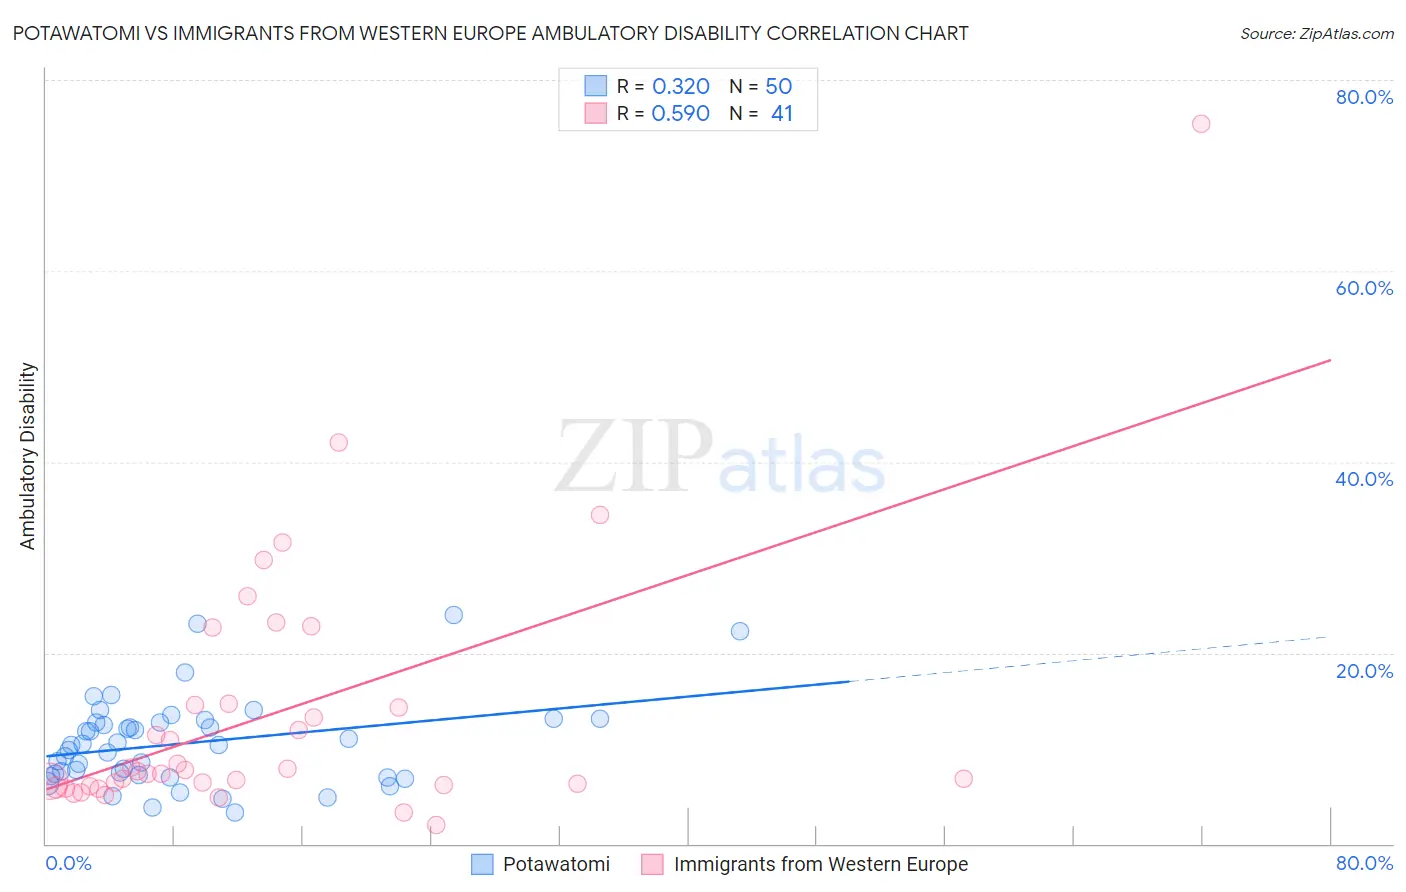
Potawatomi vs Immigrants from Western Europe Ambulatory Disability Correlation Chart
The statistical analysis conducted on geographies consisting of 117,764,729 people shows a mild positive correlation between the proportion of Potawatomi and percentage of population with ambulatory disability in the United States with a correlation coefficient (R) of 0.320 and weighted average of 7.3%. Similarly, the statistical analysis conducted on geographies consisting of 493,880,740 people shows a substantial positive correlation between the proportion of Immigrants from Western Europe and percentage of population with ambulatory disability in the United States with a correlation coefficient (R) of 0.590 and weighted average of 6.2%, a difference of 18.4%.
Ambulatory Disability Correlation Summary
| Measurement | Potawatomi | Immigrants from Western Europe |
| Minimum | 3.3% | 1.9% |
| Maximum | 23.9% | 75.4% |
| Range | 20.7% | 73.5% |
| Mean | 10.6% | 13.5% |
| Median | 10.4% | 7.6% |
| Interquartile 25% (IQ1) | 7.2% | 6.1% |
| Interquartile 75% (IQ3) | 12.7% | 14.6% |
| Interquartile Range (IQR) | 5.5% | 8.5% |
| Standard Deviation (Sample) | 4.6% | 13.7% |
| Standard Deviation (Population) | 4.6% | 13.5% |
Similar Demographics by Ambulatory Disability
Demographics Similar to Potawatomi by Ambulatory Disability
In terms of ambulatory disability, the demographic groups most similar to Potawatomi are Apache (7.4%, a difference of 0.81%), Osage (7.4%, a difference of 0.95%), American (7.4%, a difference of 1.2%), Dominican (7.2%, a difference of 1.9%), and Ottawa (7.2%, a difference of 2.2%).
| Demographics | Rating | Rank | Ambulatory Disability |
| Immigrants | Yemen | 0.0 /100 | #313 | Tragic 7.1% |
| Blackfeet | 0.0 /100 | #314 | Tragic 7.1% |
| Shoshone | 0.0 /100 | #315 | Tragic 7.1% |
| Immigrants | Dominican Republic | 0.0 /100 | #316 | Tragic 7.1% |
| Central American Indians | 0.0 /100 | #317 | Tragic 7.2% |
| Ottawa | 0.0 /100 | #318 | Tragic 7.2% |
| Dominicans | 0.0 /100 | #319 | Tragic 7.2% |
| Potawatomi | 0.0 /100 | #320 | Tragic 7.3% |
| Apache | 0.0 /100 | #321 | Tragic 7.4% |
| Osage | 0.0 /100 | #322 | Tragic 7.4% |
| Americans | 0.0 /100 | #323 | Tragic 7.4% |
| Navajo | 0.0 /100 | #324 | Tragic 7.5% |
| Comanche | 0.0 /100 | #325 | Tragic 7.5% |
| Blacks/African Americans | 0.0 /100 | #326 | Tragic 7.5% |
| Natives/Alaskans | 0.0 /100 | #327 | Tragic 7.5% |
Demographics Similar to Immigrants from Western Europe by Ambulatory Disability
In terms of ambulatory disability, the demographic groups most similar to Immigrants from Western Europe are Immigrants from Guatemala (6.2%, a difference of 0.020%), Immigrants from Western Africa (6.2%, a difference of 0.10%), Guatemalan (6.2%, a difference of 0.10%), Alaska Native (6.2%, a difference of 0.11%), and Ukrainian (6.2%, a difference of 0.14%).
| Demographics | Rating | Rank | Ambulatory Disability |
| Immigrants | Bosnia and Herzegovina | 37.2 /100 | #185 | Fair 6.2% |
| Europeans | 36.2 /100 | #186 | Fair 6.2% |
| Carpatho Rusyns | 35.3 /100 | #187 | Fair 6.2% |
| British | 34.3 /100 | #188 | Fair 6.2% |
| Ukrainians | 34.0 /100 | #189 | Fair 6.2% |
| Immigrants | Western Africa | 33.4 /100 | #190 | Fair 6.2% |
| Immigrants | Guatemala | 31.9 /100 | #191 | Fair 6.2% |
| Immigrants | Western Europe | 31.6 /100 | #192 | Fair 6.2% |
| Guatemalans | 30.0 /100 | #193 | Fair 6.2% |
| Alaska Natives | 29.8 /100 | #194 | Fair 6.2% |
| Belgians | 28.6 /100 | #195 | Fair 6.2% |
| Malaysians | 28.2 /100 | #196 | Fair 6.2% |
| Poles | 26.3 /100 | #197 | Fair 6.2% |
| Immigrants | Bangladesh | 24.6 /100 | #198 | Fair 6.2% |
| Italians | 22.6 /100 | #199 | Fair 6.2% |