Immigrants from Korea vs Immigrants from Western Europe Ambulatory Disability
COMPARE
Immigrants from Korea
Immigrants from Western Europe
Ambulatory Disability
Ambulatory Disability Comparison
Immigrants from Korea
Immigrants from Western Europe
5.2%
AMBULATORY DISABILITY
100.0/ 100
METRIC RATING
11th/ 347
METRIC RANK
6.2%
AMBULATORY DISABILITY
31.6/ 100
METRIC RATING
192nd/ 347
METRIC RANK
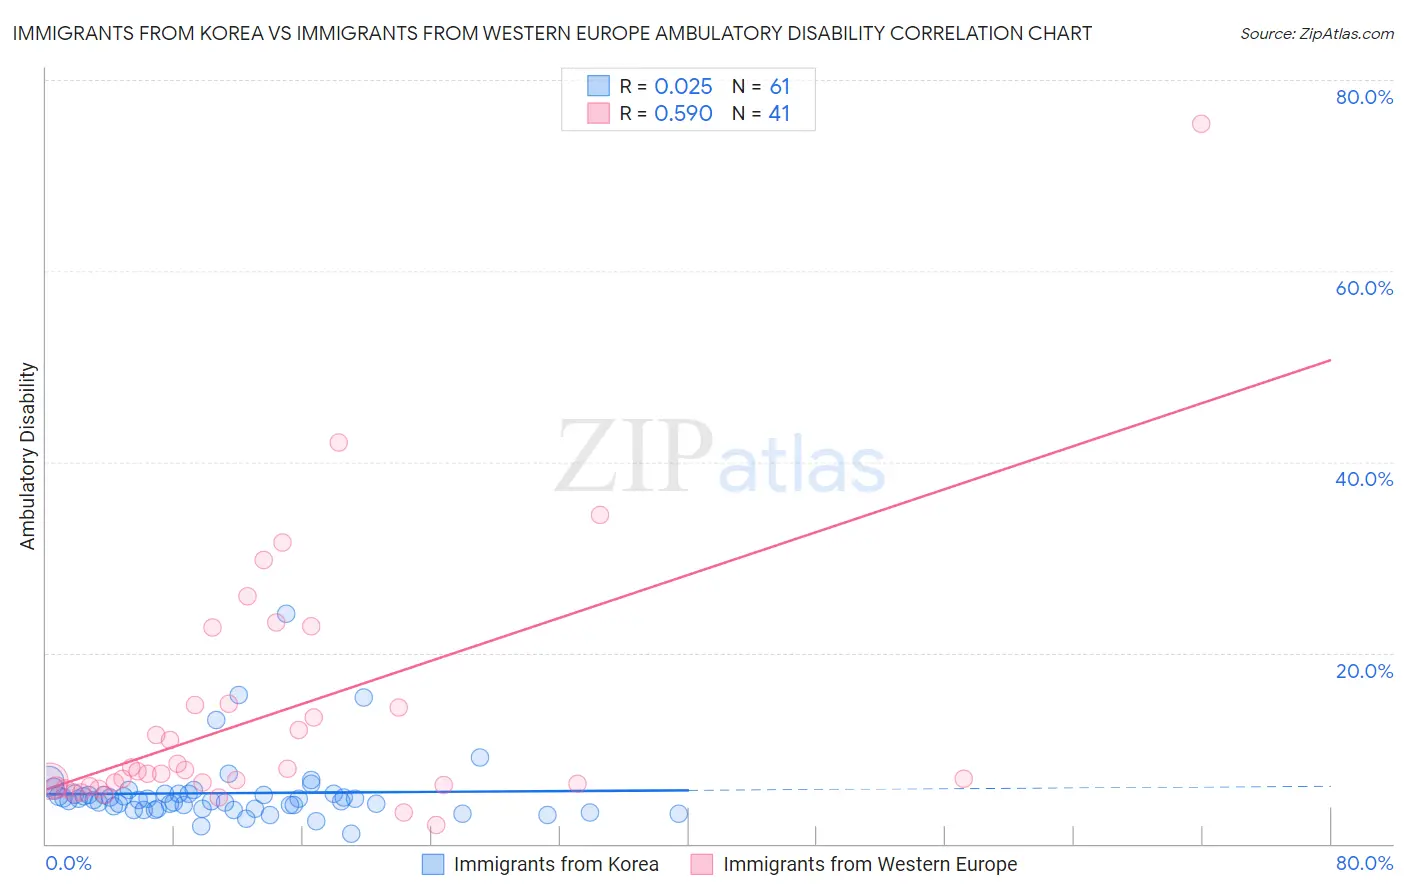
Immigrants from Korea vs Immigrants from Western Europe Ambulatory Disability Correlation Chart
The statistical analysis conducted on geographies consisting of 416,118,040 people shows no correlation between the proportion of Immigrants from Korea and percentage of population with ambulatory disability in the United States with a correlation coefficient (R) of 0.025 and weighted average of 5.2%. Similarly, the statistical analysis conducted on geographies consisting of 493,880,740 people shows a substantial positive correlation between the proportion of Immigrants from Western Europe and percentage of population with ambulatory disability in the United States with a correlation coefficient (R) of 0.590 and weighted average of 6.2%, a difference of 17.9%.
Ambulatory Disability Correlation Summary
| Measurement | Immigrants from Korea | Immigrants from Western Europe |
| Minimum | 1.1% | 1.9% |
| Maximum | 24.1% | 75.4% |
| Range | 23.0% | 73.5% |
| Mean | 5.3% | 13.5% |
| Median | 4.6% | 7.6% |
| Interquartile 25% (IQ1) | 3.7% | 6.1% |
| Interquartile 75% (IQ3) | 5.2% | 14.6% |
| Interquartile Range (IQR) | 1.6% | 8.5% |
| Standard Deviation (Sample) | 3.5% | 13.7% |
| Standard Deviation (Population) | 3.5% | 13.5% |
Similar Demographics by Ambulatory Disability
Demographics Similar to Immigrants from Korea by Ambulatory Disability
In terms of ambulatory disability, the demographic groups most similar to Immigrants from Korea are Okinawan (5.3%, a difference of 0.31%), Burmese (5.3%, a difference of 0.81%), Immigrants from Eastern Asia (5.3%, a difference of 0.96%), Immigrants from China (5.3%, a difference of 1.3%), and Yup'ik (5.2%, a difference of 1.6%).
| Demographics | Rating | Rank | Ambulatory Disability |
| Immigrants | Taiwan | 100.0 /100 | #4 | Exceptional 4.9% |
| Immigrants | Singapore | 100.0 /100 | #5 | Exceptional 5.0% |
| Immigrants | Bolivia | 100.0 /100 | #6 | Exceptional 5.0% |
| Bolivians | 100.0 /100 | #7 | Exceptional 5.1% |
| Immigrants | South Central Asia | 100.0 /100 | #8 | Exceptional 5.1% |
| Iranians | 100.0 /100 | #9 | Exceptional 5.1% |
| Yup'ik | 100.0 /100 | #10 | Exceptional 5.2% |
| Immigrants | Korea | 100.0 /100 | #11 | Exceptional 5.2% |
| Okinawans | 100.0 /100 | #12 | Exceptional 5.3% |
| Burmese | 100.0 /100 | #13 | Exceptional 5.3% |
| Immigrants | Eastern Asia | 100.0 /100 | #14 | Exceptional 5.3% |
| Immigrants | China | 100.0 /100 | #15 | Exceptional 5.3% |
| Immigrants | Hong Kong | 100.0 /100 | #16 | Exceptional 5.3% |
| Immigrants | Ethiopia | 100.0 /100 | #17 | Exceptional 5.4% |
| Immigrants | Sri Lanka | 100.0 /100 | #18 | Exceptional 5.4% |
Demographics Similar to Immigrants from Western Europe by Ambulatory Disability
In terms of ambulatory disability, the demographic groups most similar to Immigrants from Western Europe are Immigrants from Guatemala (6.2%, a difference of 0.020%), Immigrants from Western Africa (6.2%, a difference of 0.10%), Guatemalan (6.2%, a difference of 0.10%), Alaska Native (6.2%, a difference of 0.11%), and Ukrainian (6.2%, a difference of 0.14%).
| Demographics | Rating | Rank | Ambulatory Disability |
| Immigrants | Bosnia and Herzegovina | 37.2 /100 | #185 | Fair 6.2% |
| Europeans | 36.2 /100 | #186 | Fair 6.2% |
| Carpatho Rusyns | 35.3 /100 | #187 | Fair 6.2% |
| British | 34.3 /100 | #188 | Fair 6.2% |
| Ukrainians | 34.0 /100 | #189 | Fair 6.2% |
| Immigrants | Western Africa | 33.4 /100 | #190 | Fair 6.2% |
| Immigrants | Guatemala | 31.9 /100 | #191 | Fair 6.2% |
| Immigrants | Western Europe | 31.6 /100 | #192 | Fair 6.2% |
| Guatemalans | 30.0 /100 | #193 | Fair 6.2% |
| Alaska Natives | 29.8 /100 | #194 | Fair 6.2% |
| Belgians | 28.6 /100 | #195 | Fair 6.2% |
| Malaysians | 28.2 /100 | #196 | Fair 6.2% |
| Poles | 26.3 /100 | #197 | Fair 6.2% |
| Immigrants | Bangladesh | 24.6 /100 | #198 | Fair 6.2% |
| Italians | 22.6 /100 | #199 | Fair 6.2% |