Polish vs Eastern European Self-Care Disability
COMPARE
Polish
Eastern European
Self-Care Disability
Self-Care Disability Comparison
Poles
Eastern Europeans
2.4%
SELF-CARE DISABILITY
88.9/ 100
METRIC RATING
131st/ 347
METRIC RANK
2.3%
SELF-CARE DISABILITY
99.2/ 100
METRIC RATING
72nd/ 347
METRIC RANK
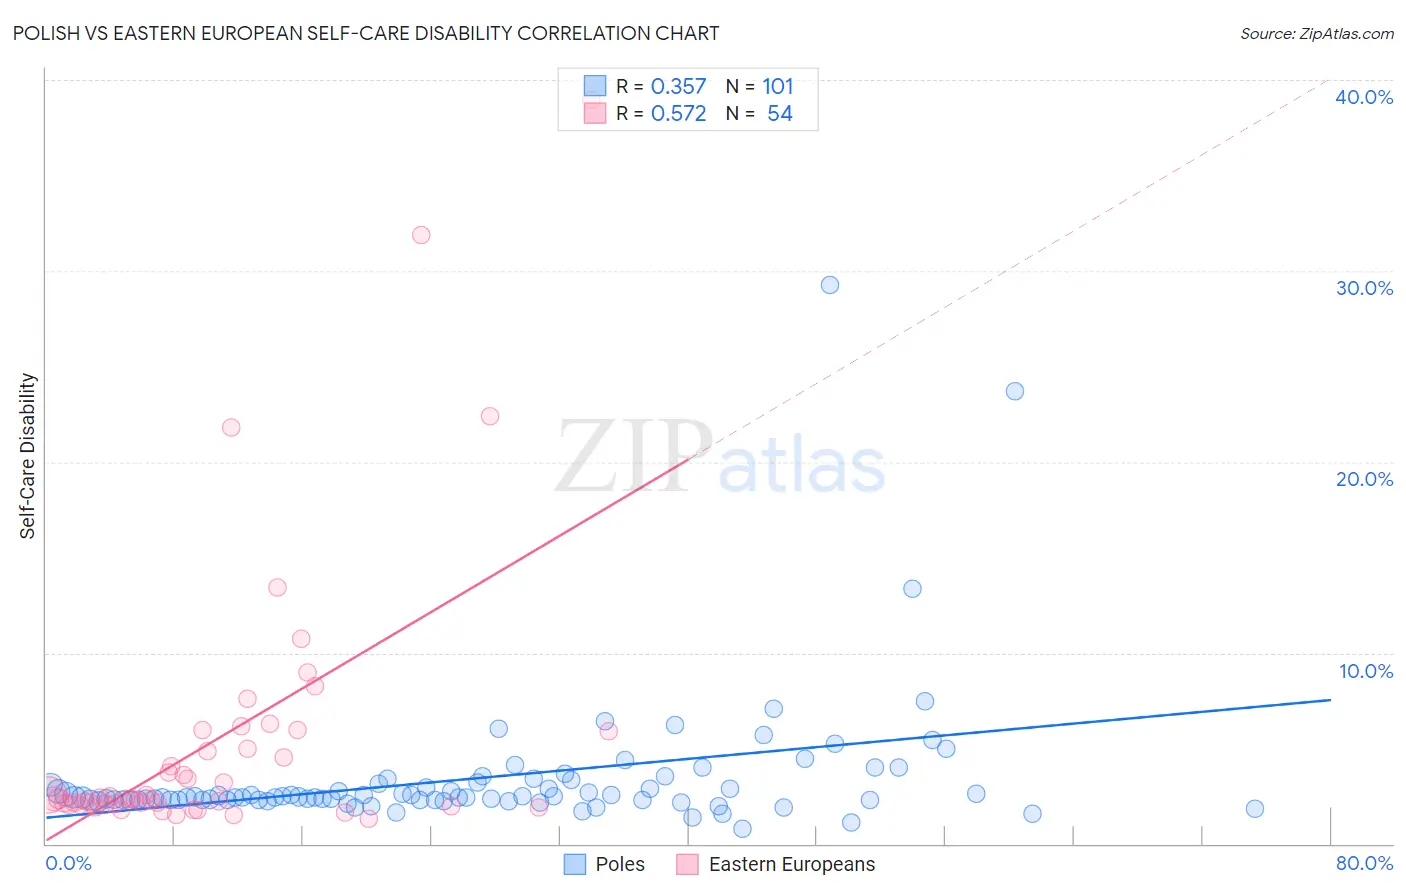
Polish vs Eastern European Self-Care Disability Correlation Chart
The statistical analysis conducted on geographies consisting of 558,400,698 people shows a mild positive correlation between the proportion of Poles and percentage of population with self-care disability in the United States with a correlation coefficient (R) of 0.357 and weighted average of 2.4%. Similarly, the statistical analysis conducted on geographies consisting of 460,402,865 people shows a substantial positive correlation between the proportion of Eastern Europeans and percentage of population with self-care disability in the United States with a correlation coefficient (R) of 0.572 and weighted average of 2.3%, a difference of 3.4%.
Self-Care Disability Correlation Summary
| Measurement | Polish | Eastern European |
| Minimum | 0.81% | 1.3% |
| Maximum | 29.3% | 39.0% |
| Range | 28.5% | 37.7% |
| Mean | 3.4% | 5.4% |
| Median | 2.4% | 2.4% |
| Interquartile 25% (IQ1) | 2.3% | 2.1% |
| Interquartile 75% (IQ3) | 3.2% | 5.9% |
| Interquartile Range (IQR) | 0.88% | 3.8% |
| Standard Deviation (Sample) | 3.7% | 7.4% |
| Standard Deviation (Population) | 3.7% | 7.3% |
Similar Demographics by Self-Care Disability
Demographics Similar to Poles by Self-Care Disability
In terms of self-care disability, the demographic groups most similar to Poles are Immigrants from South America (2.4%, a difference of 0.010%), Immigrants from Austria (2.4%, a difference of 0.020%), Immigrants from Colombia (2.4%, a difference of 0.040%), Immigrants from Romania (2.4%, a difference of 0.050%), and Russian (2.4%, a difference of 0.080%).
| Demographics | Rating | Rank | Self-Care Disability |
| Immigrants | North America | 90.2 /100 | #124 | Exceptional 2.4% |
| Immigrants | Morocco | 90.2 /100 | #124 | Exceptional 2.4% |
| Hmong | 89.9 /100 | #126 | Excellent 2.4% |
| Colombians | 89.7 /100 | #127 | Excellent 2.4% |
| Immigrants | Hungary | 89.6 /100 | #128 | Excellent 2.4% |
| Immigrants | Romania | 89.3 /100 | #129 | Excellent 2.4% |
| Immigrants | Austria | 89.0 /100 | #130 | Excellent 2.4% |
| Poles | 88.9 /100 | #131 | Excellent 2.4% |
| Immigrants | South America | 88.8 /100 | #132 | Excellent 2.4% |
| Immigrants | Colombia | 88.5 /100 | #133 | Excellent 2.4% |
| Russians | 88.2 /100 | #134 | Excellent 2.4% |
| Laotians | 87.8 /100 | #135 | Excellent 2.4% |
| South American Indians | 87.2 /100 | #136 | Excellent 2.4% |
| Austrians | 87.0 /100 | #137 | Excellent 2.4% |
| Immigrants | Croatia | 86.6 /100 | #138 | Excellent 2.4% |
Demographics Similar to Eastern Europeans by Self-Care Disability
In terms of self-care disability, the demographic groups most similar to Eastern Europeans are Asian (2.3%, a difference of 0.030%), Immigrants from Egypt (2.3%, a difference of 0.030%), Immigrants from Northern Europe (2.3%, a difference of 0.070%), Immigrants from Switzerland (2.3%, a difference of 0.090%), and Immigrants from Zaire (2.3%, a difference of 0.10%).
| Demographics | Rating | Rank | Self-Care Disability |
| Brazilians | 99.3 /100 | #65 | Exceptional 2.3% |
| Immigrants | Argentina | 99.3 /100 | #66 | Exceptional 2.3% |
| South Africans | 99.3 /100 | #67 | Exceptional 2.3% |
| Immigrants | Zaire | 99.2 /100 | #68 | Exceptional 2.3% |
| Immigrants | Norway | 99.2 /100 | #69 | Exceptional 2.3% |
| Immigrants | Northern Europe | 99.2 /100 | #70 | Exceptional 2.3% |
| Asians | 99.2 /100 | #71 | Exceptional 2.3% |
| Eastern Europeans | 99.2 /100 | #72 | Exceptional 2.3% |
| Immigrants | Egypt | 99.1 /100 | #73 | Exceptional 2.3% |
| Immigrants | Switzerland | 99.1 /100 | #74 | Exceptional 2.3% |
| Immigrants | Netherlands | 99.1 /100 | #75 | Exceptional 2.3% |
| Immigrants | China | 99.1 /100 | #76 | Exceptional 2.3% |
| Immigrants | Middle Africa | 99.0 /100 | #77 | Exceptional 2.3% |
| Immigrants | Ireland | 99.0 /100 | #78 | Exceptional 2.3% |
| Immigrants | Kenya | 99.0 /100 | #79 | Exceptional 2.3% |