Pennsylvania German vs U.S. Virgin Islander Disability Age 65 to 74
COMPARE
Pennsylvania German
U.S. Virgin Islander
Disability Age 65 to 74
Disability Age 65 to 74 Comparison
Pennsylvania Germans
U.S. Virgin Islanders
24.0%
DISABILITY AGE 65 TO 74
13.3/ 100
METRIC RATING
215th/ 347
METRIC RANK
25.9%
DISABILITY AGE 65 TO 74
0.1/ 100
METRIC RATING
279th/ 347
METRIC RANK
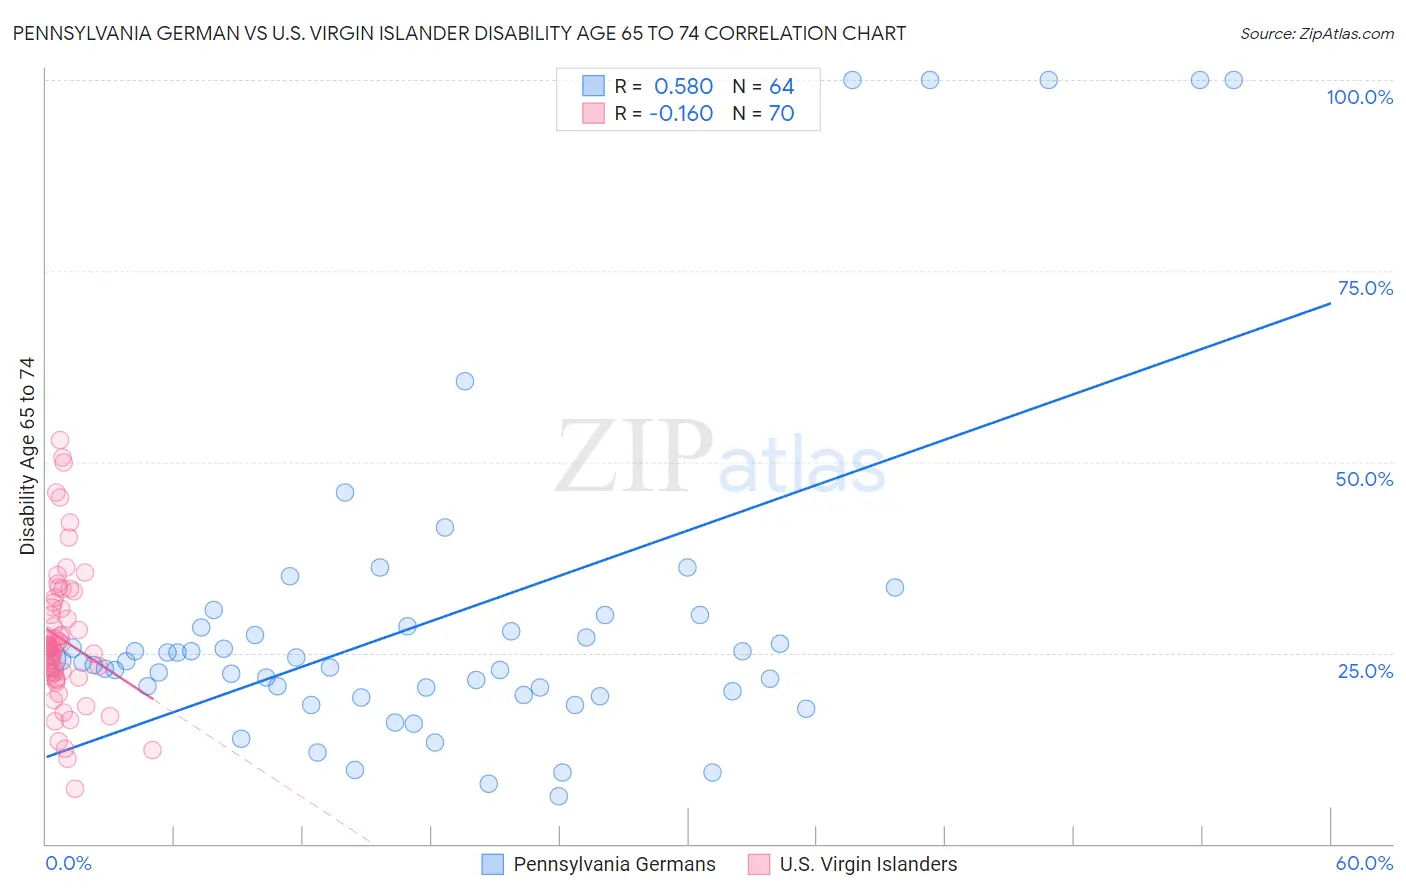
Pennsylvania German vs U.S. Virgin Islander Disability Age 65 to 74 Correlation Chart
The statistical analysis conducted on geographies consisting of 233,928,822 people shows a substantial positive correlation between the proportion of Pennsylvania Germans and percentage of population with a disability between the ages 65 and 75 in the United States with a correlation coefficient (R) of 0.580 and weighted average of 24.0%. Similarly, the statistical analysis conducted on geographies consisting of 87,465,301 people shows a poor negative correlation between the proportion of U.S. Virgin Islanders and percentage of population with a disability between the ages 65 and 75 in the United States with a correlation coefficient (R) of -0.160 and weighted average of 25.9%, a difference of 7.9%.
Disability Age 65 to 74 Correlation Summary
| Measurement | Pennsylvania German | U.S. Virgin Islander |
| Minimum | 6.3% | 7.1% |
| Maximum | 100.0% | 52.9% |
| Range | 93.7% | 45.8% |
| Mean | 29.6% | 26.8% |
| Median | 23.8% | 25.6% |
| Interquartile 25% (IQ1) | 19.7% | 22.3% |
| Interquartile 75% (IQ3) | 28.4% | 30.9% |
| Interquartile Range (IQR) | 8.6% | 8.6% |
| Standard Deviation (Sample) | 22.4% | 9.0% |
| Standard Deviation (Population) | 22.3% | 9.0% |
Similar Demographics by Disability Age 65 to 74
Demographics Similar to Pennsylvania Germans by Disability Age 65 to 74
In terms of disability age 65 to 74, the demographic groups most similar to Pennsylvania Germans are Immigrants from Oceania (24.0%, a difference of 0.040%), Nicaraguan (23.9%, a difference of 0.12%), Jamaican (24.0%, a difference of 0.13%), Immigrants from Portugal (24.0%, a difference of 0.20%), and Immigrants from Nigeria (24.0%, a difference of 0.20%).
| Demographics | Rating | Rank | Disability Age 65 to 74 |
| Immigrants | Barbados | 19.6 /100 | #208 | Poor 23.8% |
| Immigrants | Kenya | 19.6 /100 | #209 | Poor 23.8% |
| Trinidadians and Tobagonians | 16.4 /100 | #210 | Poor 23.9% |
| Immigrants | West Indies | 15.9 /100 | #211 | Poor 23.9% |
| French | 15.7 /100 | #212 | Poor 23.9% |
| Nicaraguans | 14.3 /100 | #213 | Poor 23.9% |
| Immigrants | Oceania | 13.6 /100 | #214 | Poor 24.0% |
| Pennsylvania Germans | 13.3 /100 | #215 | Poor 24.0% |
| Jamaicans | 12.2 /100 | #216 | Poor 24.0% |
| Immigrants | Portugal | 11.7 /100 | #217 | Poor 24.0% |
| Immigrants | Nigeria | 11.7 /100 | #218 | Poor 24.0% |
| Immigrants | Burma/Myanmar | 11.6 /100 | #219 | Poor 24.0% |
| Ghanaians | 10.4 /100 | #220 | Poor 24.1% |
| Immigrants | Nicaragua | 9.8 /100 | #221 | Tragic 24.1% |
| Native Hawaiians | 9.3 /100 | #222 | Tragic 24.1% |
Demographics Similar to U.S. Virgin Islanders by Disability Age 65 to 74
In terms of disability age 65 to 74, the demographic groups most similar to U.S. Virgin Islanders are Immigrants from Belize (25.8%, a difference of 0.080%), Cree (25.9%, a difference of 0.080%), Belizean (25.8%, a difference of 0.10%), Immigrants from Honduras (25.9%, a difference of 0.10%), and Delaware (25.9%, a difference of 0.18%).
| Demographics | Rating | Rank | Disability Age 65 to 74 |
| Immigrants | Dominica | 0.1 /100 | #272 | Tragic 25.7% |
| Japanese | 0.1 /100 | #273 | Tragic 25.7% |
| Americans | 0.1 /100 | #274 | Tragic 25.8% |
| Hondurans | 0.1 /100 | #275 | Tragic 25.8% |
| French American Indians | 0.1 /100 | #276 | Tragic 25.8% |
| Belizeans | 0.1 /100 | #277 | Tragic 25.8% |
| Immigrants | Belize | 0.1 /100 | #278 | Tragic 25.8% |
| U.S. Virgin Islanders | 0.1 /100 | #279 | Tragic 25.9% |
| Cree | 0.1 /100 | #280 | Tragic 25.9% |
| Immigrants | Honduras | 0.1 /100 | #281 | Tragic 25.9% |
| Delaware | 0.1 /100 | #282 | Tragic 25.9% |
| Spanish Americans | 0.0 /100 | #283 | Tragic 25.9% |
| Immigrants | Azores | 0.0 /100 | #284 | Tragic 26.0% |
| Immigrants | Congo | 0.0 /100 | #285 | Tragic 26.0% |
| Immigrants | Micronesia | 0.0 /100 | #286 | Tragic 26.1% |