Pennsylvania German vs Scotch-Irish Disability Age 65 to 74
COMPARE
Pennsylvania German
Scotch-Irish
Disability Age 65 to 74
Disability Age 65 to 74 Comparison
Pennsylvania Germans
Scotch-Irish
24.0%
DISABILITY AGE 65 TO 74
13.3/ 100
METRIC RATING
215th/ 347
METRIC RANK
24.4%
DISABILITY AGE 65 TO 74
3.8/ 100
METRIC RATING
235th/ 347
METRIC RANK
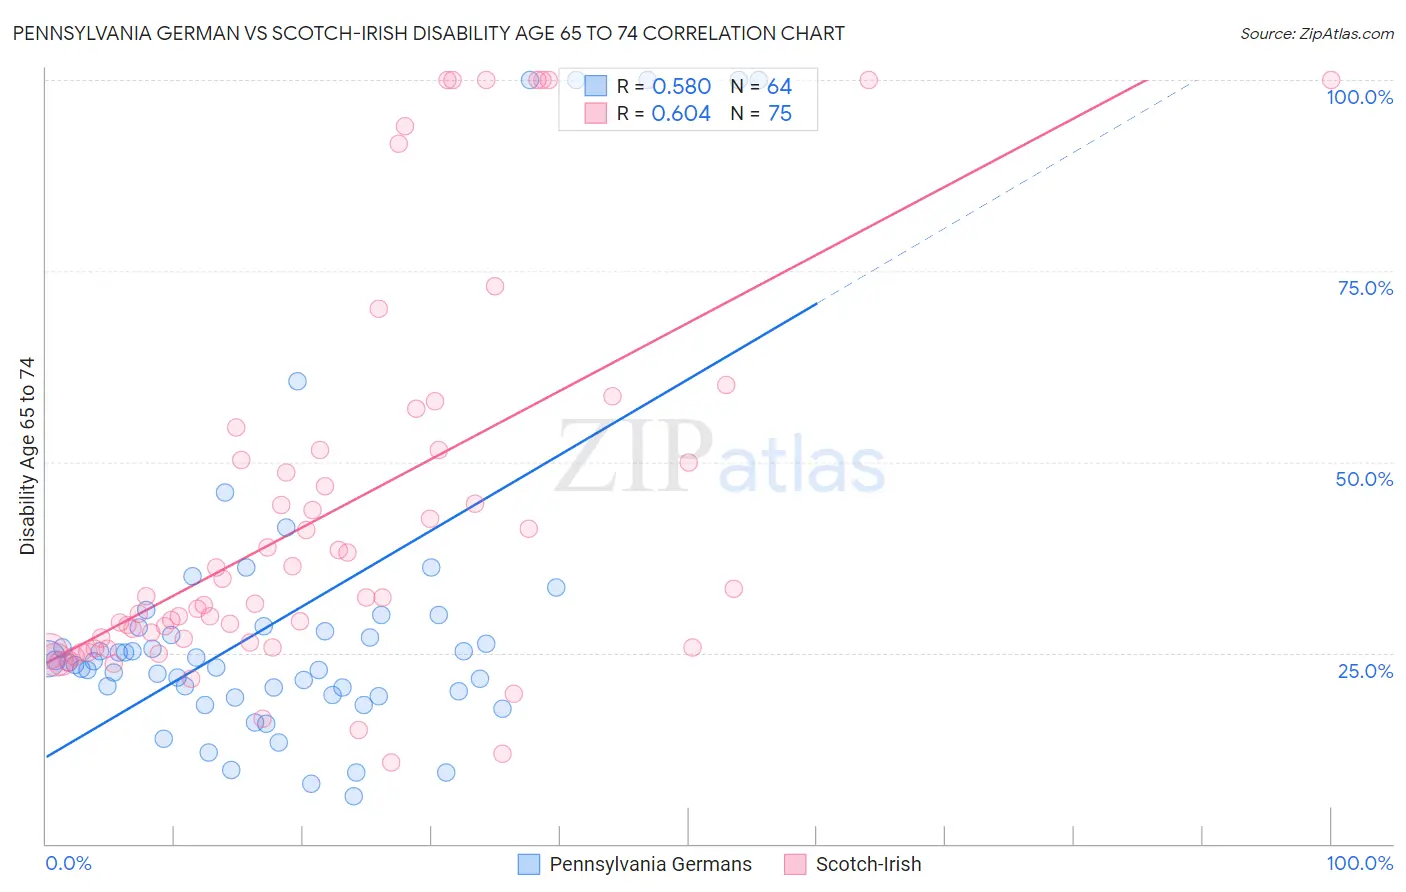
Pennsylvania German vs Scotch-Irish Disability Age 65 to 74 Correlation Chart
The statistical analysis conducted on geographies consisting of 233,928,822 people shows a substantial positive correlation between the proportion of Pennsylvania Germans and percentage of population with a disability between the ages 65 and 75 in the United States with a correlation coefficient (R) of 0.580 and weighted average of 24.0%. Similarly, the statistical analysis conducted on geographies consisting of 546,992,221 people shows a significant positive correlation between the proportion of Scotch-Irish and percentage of population with a disability between the ages 65 and 75 in the United States with a correlation coefficient (R) of 0.604 and weighted average of 24.4%, a difference of 1.9%.
Disability Age 65 to 74 Correlation Summary
| Measurement | Pennsylvania German | Scotch-Irish |
| Minimum | 6.3% | 10.7% |
| Maximum | 100.0% | 100.0% |
| Range | 93.7% | 89.3% |
| Mean | 29.6% | 43.1% |
| Median | 23.8% | 32.3% |
| Interquartile 25% (IQ1) | 19.7% | 25.8% |
| Interquartile 75% (IQ3) | 28.4% | 51.5% |
| Interquartile Range (IQR) | 8.6% | 25.7% |
| Standard Deviation (Sample) | 22.4% | 25.2% |
| Standard Deviation (Population) | 22.3% | 25.0% |
Demographics Similar to Pennsylvania Germans and Scotch-Irish by Disability Age 65 to 74
In terms of disability age 65 to 74, the demographic groups most similar to Pennsylvania Germans are Jamaican (24.0%, a difference of 0.13%), Immigrants from Portugal (24.0%, a difference of 0.20%), Immigrants from Nigeria (24.0%, a difference of 0.20%), Immigrants from Burma/Myanmar (24.0%, a difference of 0.22%), and Ghanaian (24.1%, a difference of 0.40%). Similarly, the demographic groups most similar to Scotch-Irish are Panamanian (24.4%, a difference of 0.16%), Bahamian (24.4%, a difference of 0.26%), Immigrants from Zaire (24.3%, a difference of 0.42%), Immigrants from Thailand (24.3%, a difference of 0.48%), and Barbadian (24.3%, a difference of 0.67%).
| Demographics | Rating | Rank | Disability Age 65 to 74 |
| Pennsylvania Germans | 13.3 /100 | #215 | Poor 24.0% |
| Jamaicans | 12.2 /100 | #216 | Poor 24.0% |
| Immigrants | Portugal | 11.7 /100 | #217 | Poor 24.0% |
| Immigrants | Nigeria | 11.7 /100 | #218 | Poor 24.0% |
| Immigrants | Burma/Myanmar | 11.6 /100 | #219 | Poor 24.0% |
| Ghanaians | 10.4 /100 | #220 | Poor 24.1% |
| Immigrants | Nicaragua | 9.8 /100 | #221 | Tragic 24.1% |
| Native Hawaiians | 9.3 /100 | #222 | Tragic 24.1% |
| Immigrants | Middle Africa | 8.9 /100 | #223 | Tragic 24.1% |
| Immigrants | Panama | 8.6 /100 | #224 | Tragic 24.1% |
| Bermudans | 8.2 /100 | #225 | Tragic 24.2% |
| Iraqis | 8.1 /100 | #226 | Tragic 24.2% |
| Nigerians | 7.8 /100 | #227 | Tragic 24.2% |
| Whites/Caucasians | 6.6 /100 | #228 | Tragic 24.2% |
| Celtics | 6.4 /100 | #229 | Tragic 24.2% |
| Barbadians | 6.0 /100 | #230 | Tragic 24.3% |
| Immigrants | Thailand | 5.2 /100 | #231 | Tragic 24.3% |
| Immigrants | Zaire | 5.0 /100 | #232 | Tragic 24.3% |
| Bahamians | 4.5 /100 | #233 | Tragic 24.4% |
| Panamanians | 4.2 /100 | #234 | Tragic 24.4% |
| Scotch-Irish | 3.8 /100 | #235 | Tragic 24.4% |