Pennsylvania German vs Immigrants from Sierra Leone Hearing Disability
COMPARE
Pennsylvania German
Immigrants from Sierra Leone
Hearing Disability
Hearing Disability Comparison
Pennsylvania Germans
Immigrants from Sierra Leone
3.7%
HEARING DISABILITY
0.0/ 100
METRIC RATING
301st/ 347
METRIC RANK
2.6%
HEARING DISABILITY
99.8/ 100
METRIC RATING
22nd/ 347
METRIC RANK
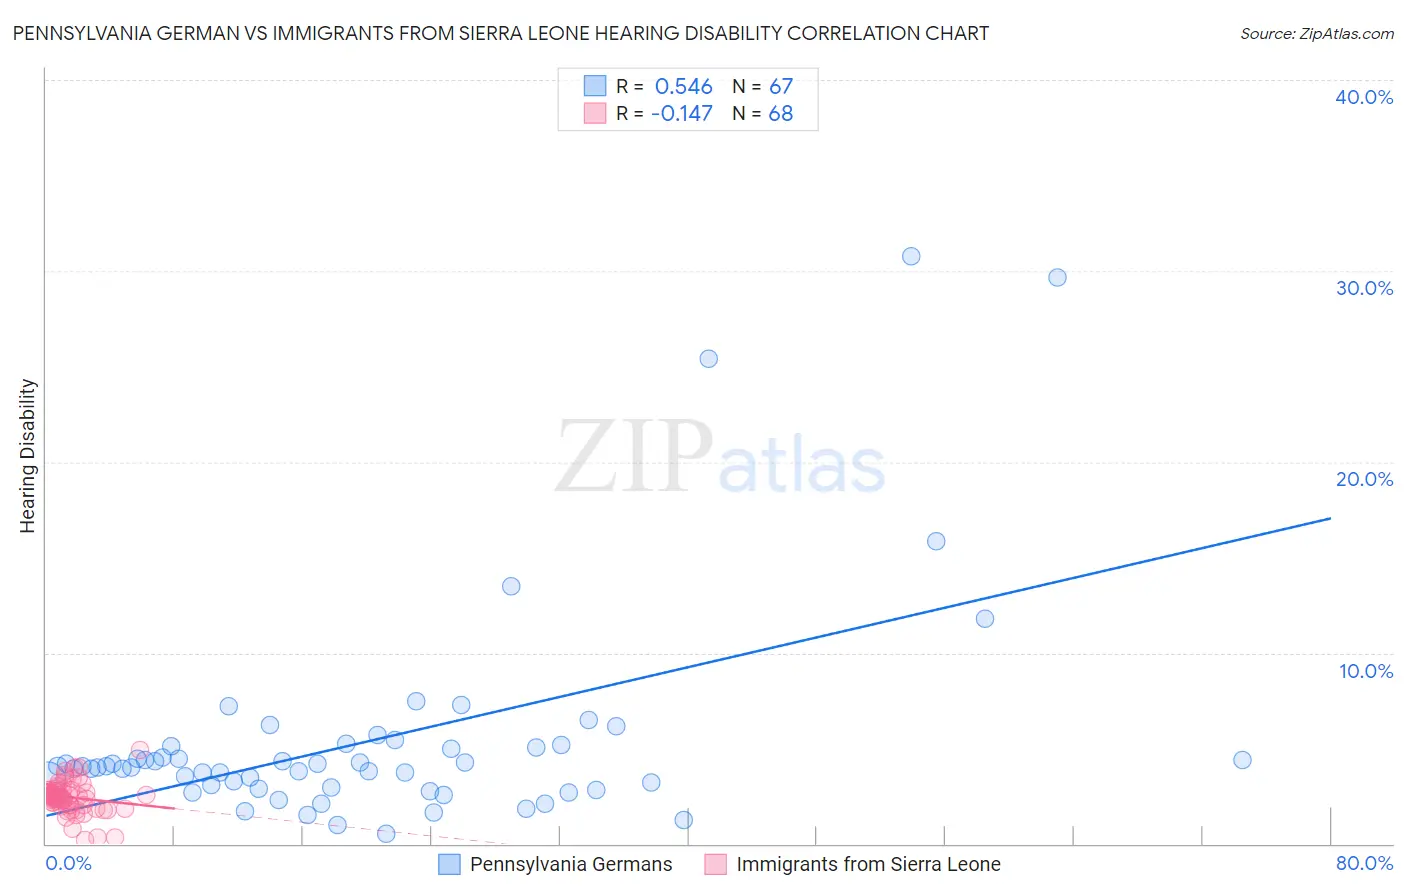
Pennsylvania German vs Immigrants from Sierra Leone Hearing Disability Correlation Chart
The statistical analysis conducted on geographies consisting of 234,065,533 people shows a substantial positive correlation between the proportion of Pennsylvania Germans and percentage of population with hearing disability in the United States with a correlation coefficient (R) of 0.546 and weighted average of 3.7%. Similarly, the statistical analysis conducted on geographies consisting of 101,639,141 people shows a poor negative correlation between the proportion of Immigrants from Sierra Leone and percentage of population with hearing disability in the United States with a correlation coefficient (R) of -0.147 and weighted average of 2.6%, a difference of 46.5%.
Hearing Disability Correlation Summary
| Measurement | Pennsylvania German | Immigrants from Sierra Leone |
| Minimum | 0.51% | 0.20% |
| Maximum | 30.8% | 4.9% |
| Range | 30.3% | 4.7% |
| Mean | 5.4% | 2.4% |
| Median | 4.0% | 2.5% |
| Interquartile 25% (IQ1) | 3.0% | 2.0% |
| Interquartile 75% (IQ3) | 5.1% | 2.8% |
| Interquartile Range (IQR) | 2.1% | 0.72% |
| Standard Deviation (Sample) | 5.7% | 0.81% |
| Standard Deviation (Population) | 5.6% | 0.80% |
Similar Demographics by Hearing Disability
Demographics Similar to Pennsylvania Germans by Hearing Disability
In terms of hearing disability, the demographic groups most similar to Pennsylvania Germans are Scottish (3.7%, a difference of 0.030%), German (3.7%, a difference of 0.090%), Dutch (3.7%, a difference of 0.11%), Menominee (3.7%, a difference of 0.16%), and Celtic (3.7%, a difference of 0.37%).
| Demographics | Rating | Rank | Hearing Disability |
| Iroquois | 0.0 /100 | #294 | Tragic 3.7% |
| Welsh | 0.0 /100 | #295 | Tragic 3.7% |
| Pima | 0.0 /100 | #296 | Tragic 3.7% |
| Immigrants | Azores | 0.0 /100 | #297 | Tragic 3.7% |
| Celtics | 0.0 /100 | #298 | Tragic 3.7% |
| Germans | 0.0 /100 | #299 | Tragic 3.7% |
| Scottish | 0.0 /100 | #300 | Tragic 3.7% |
| Pennsylvania Germans | 0.0 /100 | #301 | Tragic 3.7% |
| Dutch | 0.0 /100 | #302 | Tragic 3.7% |
| Menominee | 0.0 /100 | #303 | Tragic 3.7% |
| French | 0.0 /100 | #304 | Tragic 3.8% |
| English | 0.0 /100 | #305 | Tragic 3.8% |
| Marshallese | 0.0 /100 | #306 | Tragic 3.8% |
| French Canadians | 0.0 /100 | #307 | Tragic 3.8% |
| Ottawa | 0.0 /100 | #308 | Tragic 3.8% |
Demographics Similar to Immigrants from Sierra Leone by Hearing Disability
In terms of hearing disability, the demographic groups most similar to Immigrants from Sierra Leone are Ghanaian (2.5%, a difference of 0.040%), Immigrants from Bolivia (2.5%, a difference of 0.11%), Thai (2.5%, a difference of 0.16%), Dominican (2.5%, a difference of 0.18%), and Immigrants from Nigeria (2.6%, a difference of 0.50%).
| Demographics | Rating | Rank | Hearing Disability |
| Barbadians | 99.9 /100 | #15 | Exceptional 2.5% |
| Immigrants | West Indies | 99.9 /100 | #16 | Exceptional 2.5% |
| Immigrants | India | 99.9 /100 | #17 | Exceptional 2.5% |
| Dominicans | 99.8 /100 | #18 | Exceptional 2.5% |
| Thais | 99.8 /100 | #19 | Exceptional 2.5% |
| Immigrants | Bolivia | 99.8 /100 | #20 | Exceptional 2.5% |
| Ghanaians | 99.8 /100 | #21 | Exceptional 2.5% |
| Immigrants | Sierra Leone | 99.8 /100 | #22 | Exceptional 2.6% |
| Immigrants | Nigeria | 99.8 /100 | #23 | Exceptional 2.6% |
| Immigrants | Ghana | 99.8 /100 | #24 | Exceptional 2.6% |
| Immigrants | El Salvador | 99.7 /100 | #25 | Exceptional 2.6% |
| Immigrants | Senegal | 99.7 /100 | #26 | Exceptional 2.6% |
| Immigrants | South Central Asia | 99.7 /100 | #27 | Exceptional 2.6% |
| Immigrants | Haiti | 99.7 /100 | #28 | Exceptional 2.6% |
| Bolivians | 99.7 /100 | #29 | Exceptional 2.6% |