Immigrants from Guyana vs Immigrants from Sierra Leone Hearing Disability
COMPARE
Immigrants from Guyana
Immigrants from Sierra Leone
Hearing Disability
Hearing Disability Comparison
Immigrants from Guyana
Immigrants from Sierra Leone
2.3%
HEARING DISABILITY
100.0/ 100
METRIC RATING
4th/ 347
METRIC RANK
2.6%
HEARING DISABILITY
99.8/ 100
METRIC RATING
22nd/ 347
METRIC RANK
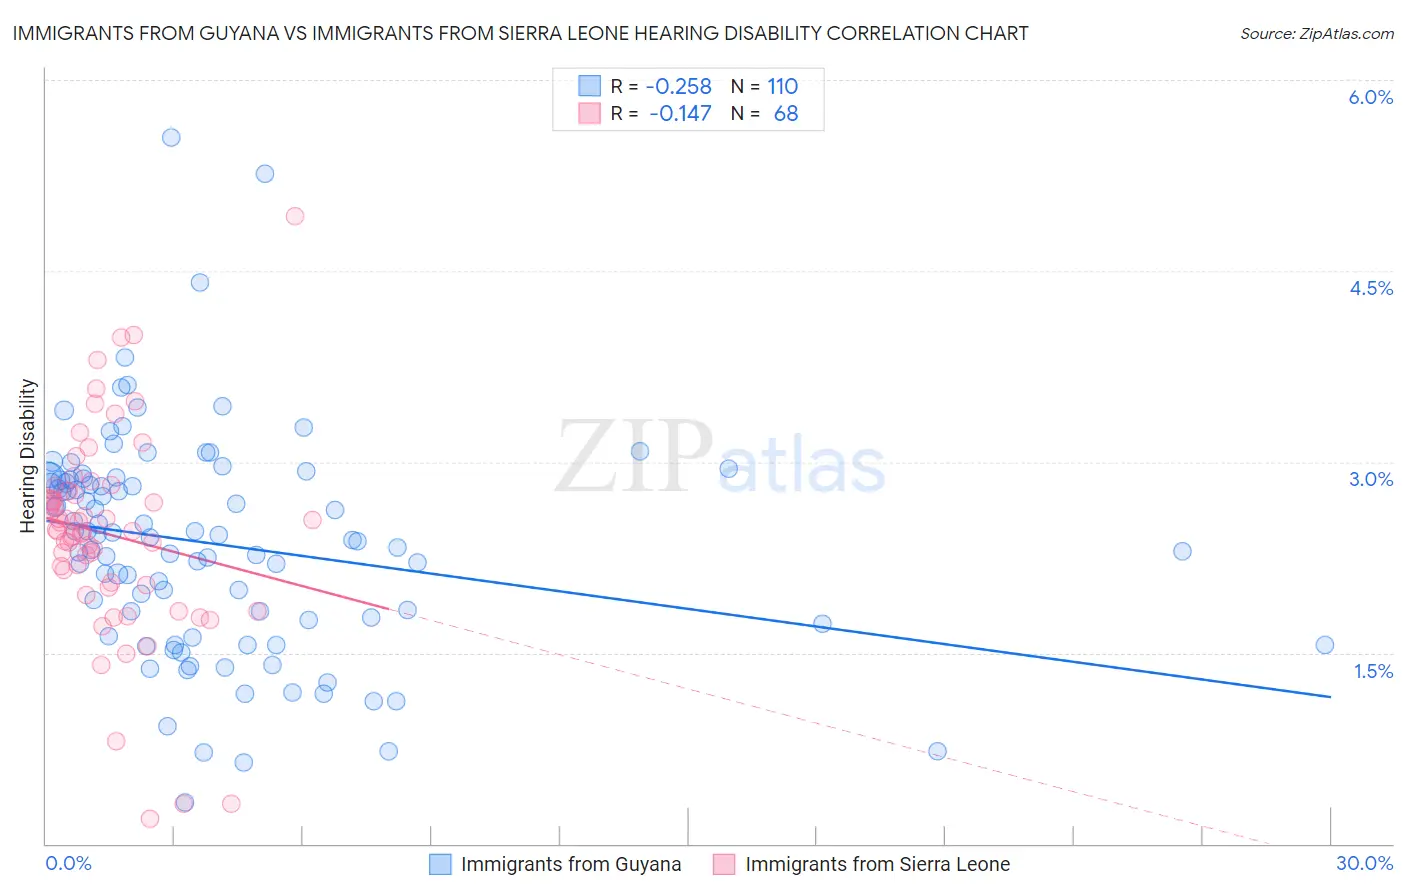
Immigrants from Guyana vs Immigrants from Sierra Leone Hearing Disability Correlation Chart
The statistical analysis conducted on geographies consisting of 183,657,050 people shows a weak negative correlation between the proportion of Immigrants from Guyana and percentage of population with hearing disability in the United States with a correlation coefficient (R) of -0.258 and weighted average of 2.3%. Similarly, the statistical analysis conducted on geographies consisting of 101,639,141 people shows a poor negative correlation between the proportion of Immigrants from Sierra Leone and percentage of population with hearing disability in the United States with a correlation coefficient (R) of -0.147 and weighted average of 2.6%, a difference of 10.0%.
Hearing Disability Correlation Summary
| Measurement | Immigrants from Guyana | Immigrants from Sierra Leone |
| Minimum | 0.33% | 0.20% |
| Maximum | 5.6% | 4.9% |
| Range | 5.2% | 4.7% |
| Mean | 2.4% | 2.4% |
| Median | 2.4% | 2.5% |
| Interquartile 25% (IQ1) | 1.8% | 2.0% |
| Interquartile 75% (IQ3) | 2.9% | 2.8% |
| Interquartile Range (IQR) | 1.1% | 0.72% |
| Standard Deviation (Sample) | 0.87% | 0.81% |
| Standard Deviation (Population) | 0.86% | 0.80% |
Demographics Similar to Immigrants from Guyana and Immigrants from Sierra Leone by Hearing Disability
In terms of hearing disability, the demographic groups most similar to Immigrants from Guyana are Guyanese (2.3%, a difference of 1.4%), Immigrants from Barbados (2.4%, a difference of 1.9%), Vietnamese (2.4%, a difference of 3.0%), Immigrants from Bangladesh (2.4%, a difference of 4.6%), and British West Indian (2.4%, a difference of 4.8%). Similarly, the demographic groups most similar to Immigrants from Sierra Leone are Ghanaian (2.5%, a difference of 0.040%), Immigrants from Bolivia (2.5%, a difference of 0.11%), Thai (2.5%, a difference of 0.16%), Dominican (2.5%, a difference of 0.18%), and Immigrants from Nigeria (2.6%, a difference of 0.50%).
| Demographics | Rating | Rank | Hearing Disability |
| Guyanese | 100.0 /100 | #3 | Exceptional 2.3% |
| Immigrants | Guyana | 100.0 /100 | #4 | Exceptional 2.3% |
| Immigrants | Barbados | 100.0 /100 | #5 | Exceptional 2.4% |
| Vietnamese | 100.0 /100 | #6 | Exceptional 2.4% |
| Immigrants | Bangladesh | 100.0 /100 | #7 | Exceptional 2.4% |
| British West Indians | 100.0 /100 | #8 | Exceptional 2.4% |
| Immigrants | Dominican Republic | 100.0 /100 | #9 | Exceptional 2.4% |
| Immigrants | Ecuador | 99.9 /100 | #10 | Exceptional 2.5% |
| Immigrants | Trinidad and Tobago | 99.9 /100 | #11 | Exceptional 2.5% |
| Trinidadians and Tobagonians | 99.9 /100 | #12 | Exceptional 2.5% |
| Sierra Leoneans | 99.9 /100 | #13 | Exceptional 2.5% |
| Ecuadorians | 99.9 /100 | #14 | Exceptional 2.5% |
| Barbadians | 99.9 /100 | #15 | Exceptional 2.5% |
| Immigrants | West Indies | 99.9 /100 | #16 | Exceptional 2.5% |
| Immigrants | India | 99.9 /100 | #17 | Exceptional 2.5% |
| Dominicans | 99.8 /100 | #18 | Exceptional 2.5% |
| Thais | 99.8 /100 | #19 | Exceptional 2.5% |
| Immigrants | Bolivia | 99.8 /100 | #20 | Exceptional 2.5% |
| Ghanaians | 99.8 /100 | #21 | Exceptional 2.5% |
| Immigrants | Sierra Leone | 99.8 /100 | #22 | Exceptional 2.6% |
| Immigrants | Nigeria | 99.8 /100 | #23 | Exceptional 2.6% |