Pennsylvania German vs Colombian Disability Age 18 to 34
COMPARE
Pennsylvania German
Colombian
Disability Age 18 to 34
Disability Age 18 to 34 Comparison
Pennsylvania Germans
Colombians
7.8%
DISABILITY AGE 18 TO 34
0.0/ 100
METRIC RATING
308th/ 347
METRIC RANK
5.9%
DISABILITY AGE 18 TO 34
99.8/ 100
METRIC RATING
42nd/ 347
METRIC RANK
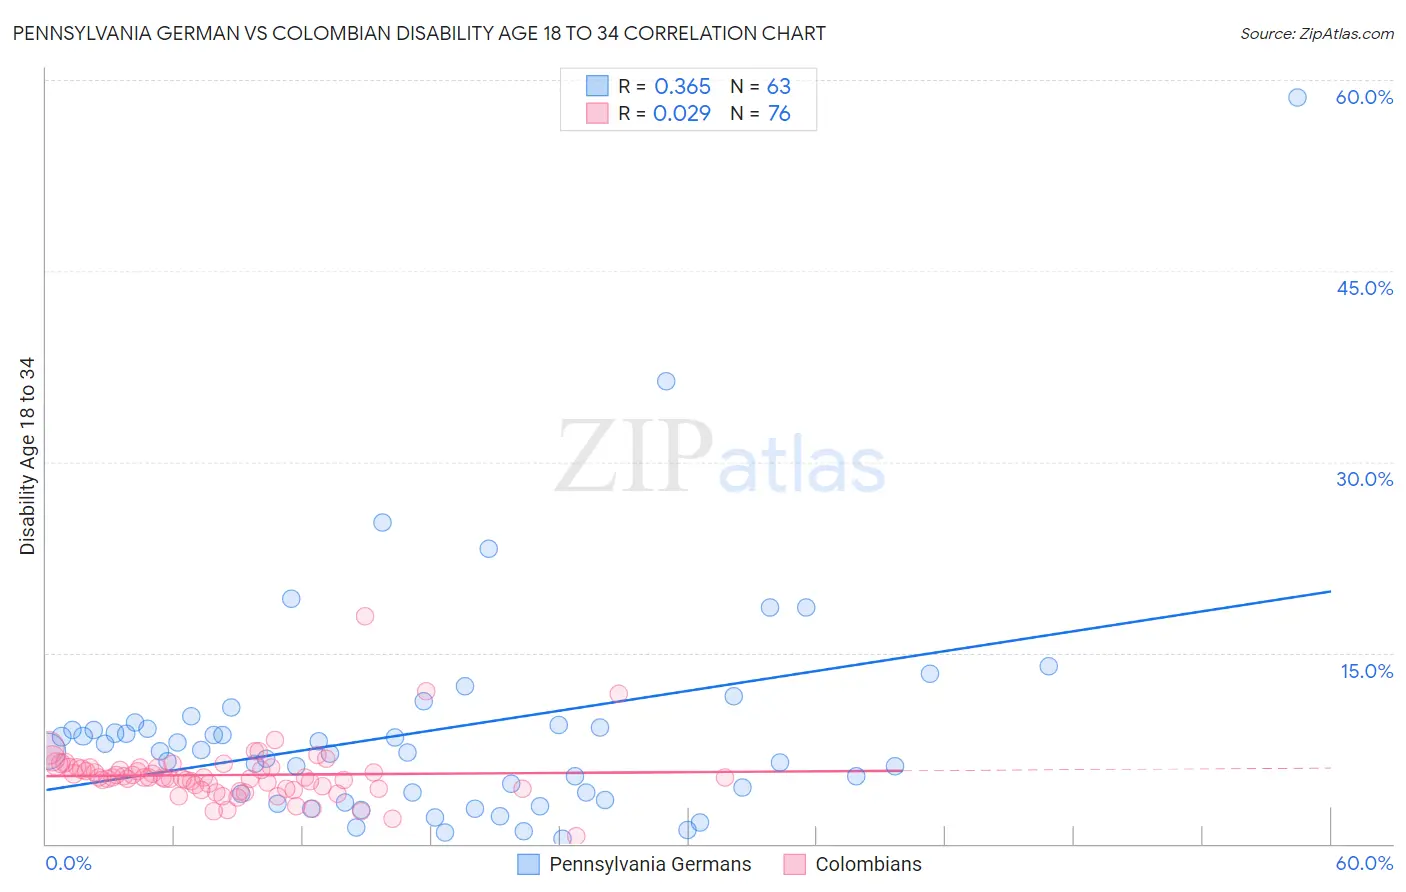
Pennsylvania German vs Colombian Disability Age 18 to 34 Correlation Chart
The statistical analysis conducted on geographies consisting of 233,477,227 people shows a mild positive correlation between the proportion of Pennsylvania Germans and percentage of population with a disability between the ages 18 and 35 in the United States with a correlation coefficient (R) of 0.365 and weighted average of 7.8%. Similarly, the statistical analysis conducted on geographies consisting of 418,761,238 people shows no correlation between the proportion of Colombians and percentage of population with a disability between the ages 18 and 35 in the United States with a correlation coefficient (R) of 0.029 and weighted average of 5.9%, a difference of 33.3%.
Disability Age 18 to 34 Correlation Summary
| Measurement | Pennsylvania German | Colombian |
| Minimum | 0.39% | 0.61% |
| Maximum | 58.7% | 17.9% |
| Range | 58.3% | 17.3% |
| Mean | 8.9% | 5.4% |
| Median | 7.3% | 5.2% |
| Interquartile 25% (IQ1) | 4.0% | 4.3% |
| Interquartile 75% (IQ3) | 9.3% | 6.0% |
| Interquartile Range (IQR) | 5.4% | 1.7% |
| Standard Deviation (Sample) | 9.0% | 2.2% |
| Standard Deviation (Population) | 8.9% | 2.2% |
Similar Demographics by Disability Age 18 to 34
Demographics Similar to Pennsylvania Germans by Disability Age 18 to 34
In terms of disability age 18 to 34, the demographic groups most similar to Pennsylvania Germans are Alaska Native (7.8%, a difference of 0.010%), Scotch-Irish (7.8%, a difference of 0.030%), Finnish (7.8%, a difference of 0.070%), English (7.8%, a difference of 0.28%), and Menominee (7.8%, a difference of 0.37%).
| Demographics | Rating | Rank | Disability Age 18 to 34 |
| Pima | 0.0 /100 | #301 | Tragic 7.7% |
| Welsh | 0.0 /100 | #302 | Tragic 7.7% |
| Cheyenne | 0.0 /100 | #303 | Tragic 7.7% |
| Shoshone | 0.0 /100 | #304 | Tragic 7.8% |
| Menominee | 0.0 /100 | #305 | Tragic 7.8% |
| English | 0.0 /100 | #306 | Tragic 7.8% |
| Scotch-Irish | 0.0 /100 | #307 | Tragic 7.8% |
| Pennsylvania Germans | 0.0 /100 | #308 | Tragic 7.8% |
| Alaska Natives | 0.0 /100 | #309 | Tragic 7.8% |
| Finns | 0.0 /100 | #310 | Tragic 7.8% |
| French | 0.0 /100 | #311 | Tragic 7.9% |
| Spanish Americans | 0.0 /100 | #312 | Tragic 7.9% |
| Iroquois | 0.0 /100 | #313 | Tragic 7.9% |
| Colville | 0.0 /100 | #314 | Tragic 7.9% |
| Americans | 0.0 /100 | #315 | Tragic 8.0% |
Demographics Similar to Colombians by Disability Age 18 to 34
In terms of disability age 18 to 34, the demographic groups most similar to Colombians are South American (5.9%, a difference of 0.020%), Immigrants from Asia (5.9%, a difference of 0.040%), Immigrants from Peru (5.9%, a difference of 0.17%), Nicaraguan (5.8%, a difference of 0.22%), and Immigrants from Korea (5.9%, a difference of 0.30%).
| Demographics | Rating | Rank | Disability Age 18 to 34 |
| Immigrants | Lithuania | 99.9 /100 | #35 | Exceptional 5.8% |
| Ecuadorians | 99.9 /100 | #36 | Exceptional 5.8% |
| Armenians | 99.9 /100 | #37 | Exceptional 5.8% |
| Immigrants | South America | 99.9 /100 | #38 | Exceptional 5.8% |
| Asians | 99.9 /100 | #39 | Exceptional 5.8% |
| Bolivians | 99.9 /100 | #40 | Exceptional 5.8% |
| Nicaraguans | 99.9 /100 | #41 | Exceptional 5.8% |
| Colombians | 99.8 /100 | #42 | Exceptional 5.9% |
| South Americans | 99.8 /100 | #43 | Exceptional 5.9% |
| Immigrants | Asia | 99.8 /100 | #44 | Exceptional 5.9% |
| Immigrants | Peru | 99.8 /100 | #45 | Exceptional 5.9% |
| Immigrants | Korea | 99.8 /100 | #46 | Exceptional 5.9% |
| Immigrants | Egypt | 99.8 /100 | #47 | Exceptional 5.9% |
| Immigrants | Trinidad and Tobago | 99.8 /100 | #48 | Exceptional 5.9% |
| Immigrants | Belarus | 99.8 /100 | #49 | Exceptional 5.9% |