Immigrants from South Africa vs Colombian Disability Age 18 to 34
COMPARE
Immigrants from South Africa
Colombian
Disability Age 18 to 34
Disability Age 18 to 34 Comparison
Immigrants from South Africa
Colombians
6.4%
DISABILITY AGE 18 TO 34
83.7/ 100
METRIC RATING
147th/ 347
METRIC RANK
5.9%
DISABILITY AGE 18 TO 34
99.8/ 100
METRIC RATING
42nd/ 347
METRIC RANK
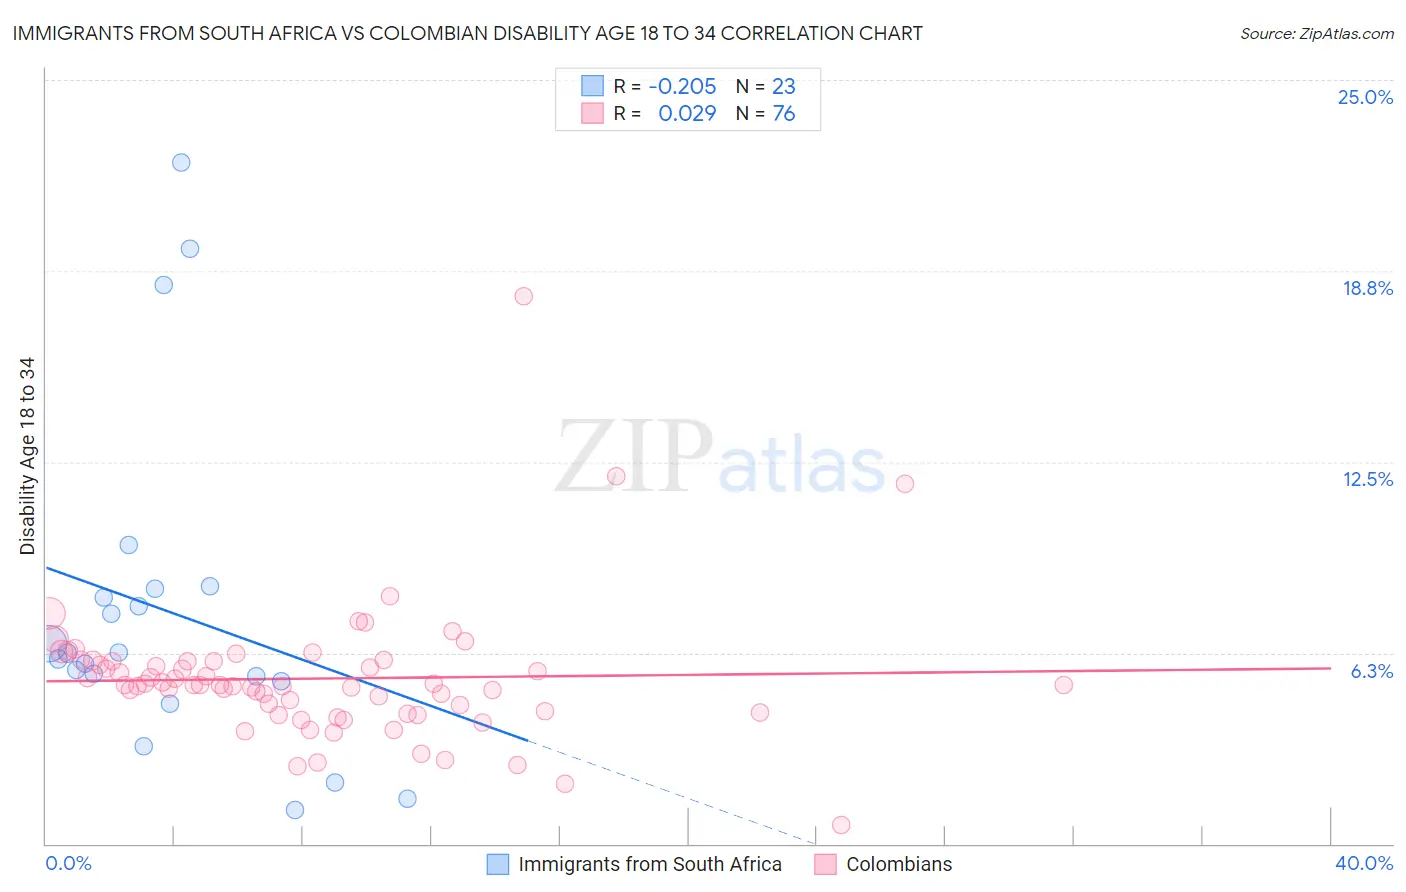
Immigrants from South Africa vs Colombian Disability Age 18 to 34 Correlation Chart
The statistical analysis conducted on geographies consisting of 232,965,989 people shows a weak negative correlation between the proportion of Immigrants from South Africa and percentage of population with a disability between the ages 18 and 35 in the United States with a correlation coefficient (R) of -0.205 and weighted average of 6.4%. Similarly, the statistical analysis conducted on geographies consisting of 418,761,238 people shows no correlation between the proportion of Colombians and percentage of population with a disability between the ages 18 and 35 in the United States with a correlation coefficient (R) of 0.029 and weighted average of 5.9%, a difference of 9.5%.
Disability Age 18 to 34 Correlation Summary
| Measurement | Immigrants from South Africa | Colombian |
| Minimum | 1.1% | 0.61% |
| Maximum | 22.3% | 17.9% |
| Range | 21.2% | 17.3% |
| Mean | 7.6% | 5.4% |
| Median | 6.2% | 5.2% |
| Interquartile 25% (IQ1) | 5.3% | 4.3% |
| Interquartile 75% (IQ3) | 8.4% | 6.0% |
| Interquartile Range (IQR) | 3.0% | 1.7% |
| Standard Deviation (Sample) | 5.4% | 2.2% |
| Standard Deviation (Population) | 5.3% | 2.2% |
Similar Demographics by Disability Age 18 to 34
Demographics Similar to Immigrants from South Africa by Disability Age 18 to 34
In terms of disability age 18 to 34, the demographic groups most similar to Immigrants from South Africa are Immigrants from Belgium (6.4%, a difference of 0.020%), Honduran (6.4%, a difference of 0.070%), Immigrants from Dominican Republic (6.4%, a difference of 0.12%), Belizean (6.4%, a difference of 0.16%), and Moroccan (6.4%, a difference of 0.21%).
| Demographics | Rating | Rank | Disability Age 18 to 34 |
| Immigrants | Fiji | 87.3 /100 | #140 | Excellent 6.4% |
| Jamaicans | 86.8 /100 | #141 | Excellent 6.4% |
| South American Indians | 86.5 /100 | #142 | Excellent 6.4% |
| Immigrants | Latvia | 86.4 /100 | #143 | Excellent 6.4% |
| Albanians | 85.3 /100 | #144 | Excellent 6.4% |
| Moroccans | 85.2 /100 | #145 | Excellent 6.4% |
| Belizeans | 84.9 /100 | #146 | Excellent 6.4% |
| Immigrants | South Africa | 83.7 /100 | #147 | Excellent 6.4% |
| Immigrants | Belgium | 83.5 /100 | #148 | Excellent 6.4% |
| Hondurans | 83.1 /100 | #149 | Excellent 6.4% |
| Immigrants | Dominican Republic | 82.7 /100 | #150 | Excellent 6.4% |
| Tongans | 81.9 /100 | #151 | Excellent 6.4% |
| Bulgarians | 78.3 /100 | #152 | Good 6.5% |
| Immigrants | Eritrea | 77.4 /100 | #153 | Good 6.5% |
| Immigrants | Central America | 76.8 /100 | #154 | Good 6.5% |
Demographics Similar to Colombians by Disability Age 18 to 34
In terms of disability age 18 to 34, the demographic groups most similar to Colombians are South American (5.9%, a difference of 0.020%), Immigrants from Asia (5.9%, a difference of 0.040%), Immigrants from Peru (5.9%, a difference of 0.17%), Nicaraguan (5.8%, a difference of 0.22%), and Immigrants from Korea (5.9%, a difference of 0.30%).
| Demographics | Rating | Rank | Disability Age 18 to 34 |
| Immigrants | Lithuania | 99.9 /100 | #35 | Exceptional 5.8% |
| Ecuadorians | 99.9 /100 | #36 | Exceptional 5.8% |
| Armenians | 99.9 /100 | #37 | Exceptional 5.8% |
| Immigrants | South America | 99.9 /100 | #38 | Exceptional 5.8% |
| Asians | 99.9 /100 | #39 | Exceptional 5.8% |
| Bolivians | 99.9 /100 | #40 | Exceptional 5.8% |
| Nicaraguans | 99.9 /100 | #41 | Exceptional 5.8% |
| Colombians | 99.8 /100 | #42 | Exceptional 5.9% |
| South Americans | 99.8 /100 | #43 | Exceptional 5.9% |
| Immigrants | Asia | 99.8 /100 | #44 | Exceptional 5.9% |
| Immigrants | Peru | 99.8 /100 | #45 | Exceptional 5.9% |
| Immigrants | Korea | 99.8 /100 | #46 | Exceptional 5.9% |
| Immigrants | Egypt | 99.8 /100 | #47 | Exceptional 5.9% |
| Immigrants | Trinidad and Tobago | 99.8 /100 | #48 | Exceptional 5.9% |
| Immigrants | Belarus | 99.8 /100 | #49 | Exceptional 5.9% |